Hi Ansely,
Thanks a lot. Now I can have better figures for the ARGO data guided by your truly-helpful suggestion.
I need one more refinement.
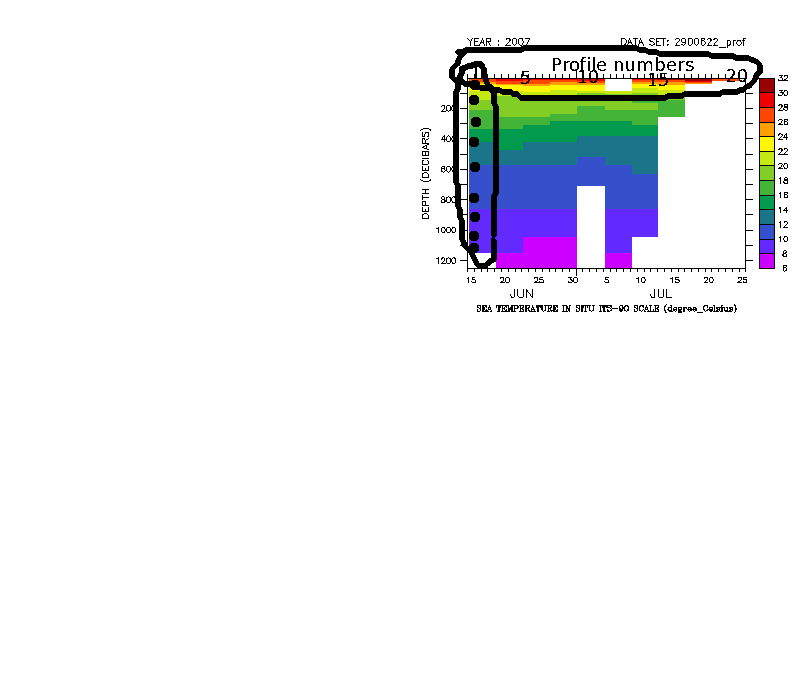
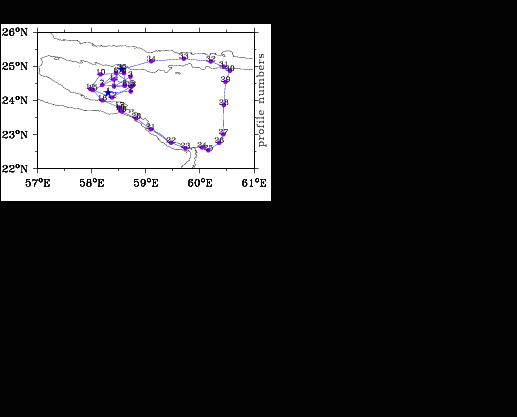
As indicated in an attached gif image (2900622_T.gif), I would like to have profile numbers on the top axis that are helpful to identify locations of each profile (see attached section-1.gif) , together with time axis on the bottom axis that is already drawn. Also, I need to locate data points using some marks such as filled circles.
Thanks in advance.
Chan Joo
--------------------------------------- [ Original Message ] --------------------------------------
Sender : Ansley Manke < Ansley.B.Manke@xxxxxxxx >
To : Chan Joo Jang < cjjang@xxxxxxxxxxx >
CC : oar.pmel.ferret_users@xxxxxxxx
Date : 2007-12-19 05:25:56
S u b j e c t : Re: [want real z-axis]Re: [ferret_users] change axis
Hi Chan Joo,
I was wrong before when I said that ZAXREPLACE wouldn't allow the second
argument to vary in time. It does. Here is a script that works with
the ARGO data. I'll put together an FAQ on this, as it'll be of general
interest.
In the figure are the pressure and temperature fields on the left, and
the regridded temperature-on-pressure field to the right.
It's important to define a fixed pressure axis for the result of the
zaxreplace definition, rather than using a profile from a dataset,
because a particular profile in a dataset may have missing data, and
also because it makes the data consistent and comparable from one file
to another. I made a list of pressures from one of the files, and
rounded off the values to the nearest 5 or 10 or 100 and so on.
! USE/ORDER=ZT 2900623_prof.nc
USE/ORDER=ZT2900622_prof.nc
! Define a time axis based on JULD
DEF AXIS/T/T0="1-JAN-1950:00:00"/UNITS=days tday=juld
LET zz=Z[GZ=temp]
DEF AXIS/Z/UNITS=levels/DEPTH zlev=zz
! Put the temperature and pressure on this corrected time-layer grid
LET/UNITS="`pres,R=units`"/TITLE="`pres,R=title`"/BAD=`pres,R=bad` \
pressure=pres[gz=zlev@asn,gt=tday@asn]
LET/UNITS="`temp,R=units`"/TITLE="`temp,R=title`"/BAD=`temp,R=bad` \
temperature=temp[gz=zlev@asn,gt=tday@asn]
SET VIEW ul
SHADE pressure
SET VIEW ll
SHADE temperature
! Define an output Z axis with units of pressure.
DEFINE AXIS/Z/UNITS=decibars/DEPTH zpres= {5.,10.,15.,20.,25.,30.,34.,40.\
,45.,50.,55.,60.,65.,70.,75.,80.,85.,90.,95.,100.,105.,110.,120.,130.,\
140.,160.,180.,200.,225.,250.,275.,300.,325.,350.,375.,400.,450.,500.,\
550.,600.,675.,750.,825.,900.,1000.,1100.,1200.}
! Call zaxreplace to put the temperature data on this new pressure axis
LET/UNITS="`temperature,R=units`"/TITLE="`temperature,R=title`" \
temp_on_pres=ZAXREPLACE(temperature,pressure,Z[GZ=zpres])
SET VIEW ur
SHADE temp_on_pres
Attachment:
2900622_T.gif
Description: GIF image
Attachment:
section-1.gif
Description: GIF image