There may be a discontinuity in the X coordinates, a crossing of the branch cut, for example along a given K value, x may run 356, 358, 0, 2 and that's causing this odd behavior. You'll see whether this is what's happening if you draw a line plot of your X coordinates, for instance
yes? PLOT/k=4 dxyk
If this is the case, it's quite likely you can get correct plots with the /MODULO qualifier,
yes? fill/modulo/hlimits=0:360 chlgca, dxyk, zxy
which does, essentially, the fill plot as specified, and then an overlay with xcoords+360 and xcoords-360 as needed to fill in the values in the region of X you have specified.
Ansley
Nicole Goebel wrote:
Hi,
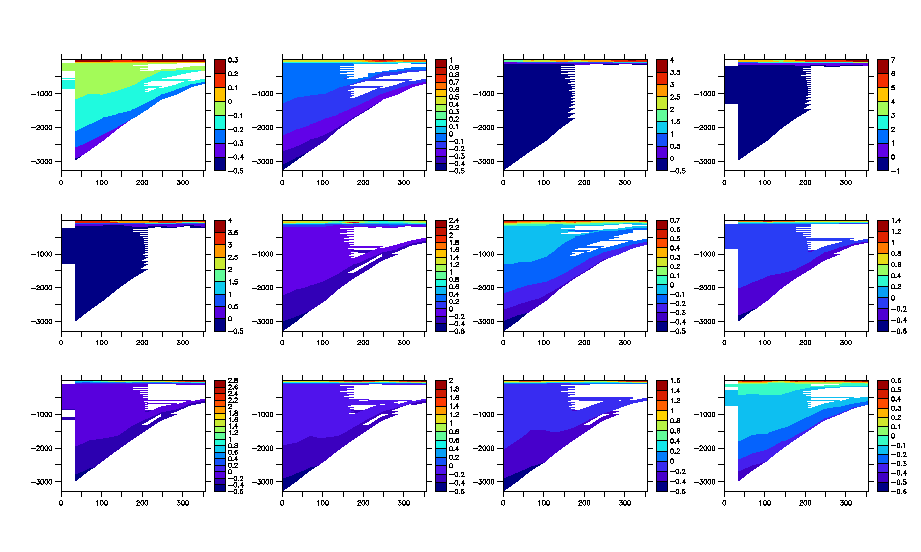
I am attempting to plot a profile section (x vs z) of a 3-d domain. However, when I plot using:
fill chlgca, dxyk, zxy
the resulting plot has alot of blank/white spaces. Note that dxyk is based on a conversion of x and y coordinates to a distance using the following piece of code:
! Find x and y coordinates ____________________________________
let xgca = x1 + (i[i=1:11]-1)*(x2-x1)/(11-1)
let ygca = y1 + (i[i=1:11]-1)*(y2-y1)/(11-1)
! Find data closest to transect line ________________________________
let chlgca = samplexy_curv(chlclm,lon_rho,lat_rho,xgca,ygca)
!Calculate depths ________________________________________________________
let sc = (k[k=1:30]-30-.5)/30
let cs = zsequence(cs_r)
let cf1 = `hc`*(sc-cs); let cf2 = cs
let hinv = 1/h
let zdep0 = cf1*h/h+cf2*h
let zdep = zdep0+zeta*(1+zdep0*hinv)
! sample depths for transect _________________________________________
let zxy = samplexy_curv(zdep0,lon_rho,lat_rho,xgca,ygca)
! Convert long and lats to distance? ____________________________
let dxyd = (((xgca-xgca[i=1])*cos(ygca*3.14159/180))^2+(ygca-ygca[i=1])^2)^.5
let dxyk = dxyd*60*1.852
define axis/x/from/units=km dist = dxyk
let dxykz = dxyk*zxy/zxy
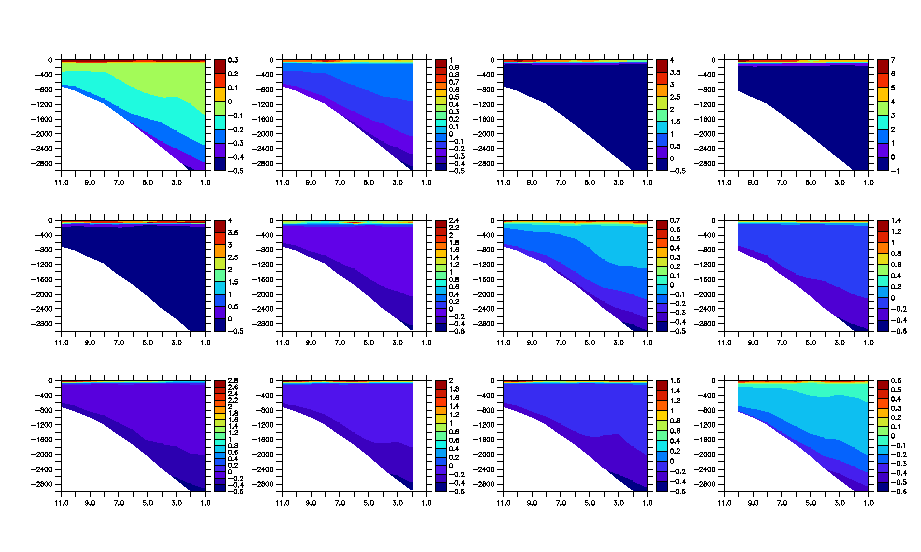
However, if I plot using:
fill chlgca, i[i=1:11], zxy
the plot looks to be OK (although a bit sure about some of the axes....)
I have attached some plots to demonstrate this.
Has anyone had this issue? Or better yet, found a way to resolve it (other than using the second option which does not give me the proper xaxis labels)?
Thanks,
Nicole
PS I am using ferret ver:
FERRET v6.08 Linux(g77) 2.6.9-22. - 11/13/07