Hi Ansley:
I also think that Argo netCDF data is weird. Most of the Argo data have such weird vertical levels.
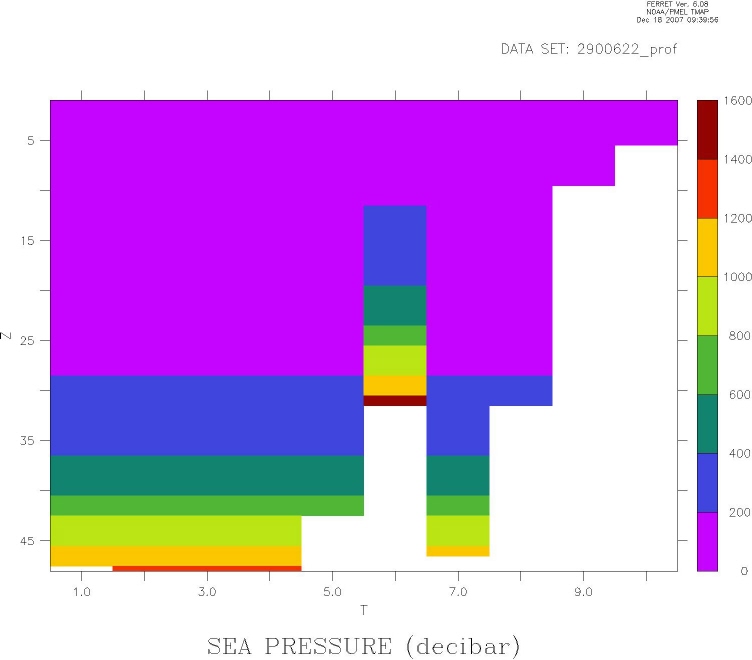
Please find attached files that show the same problem in vertical levels.
I do not think that the problem will be solved soon.
I am still hoping to have the ZAXREPLACE function that can handle time-varing z-axis, because I do not want to ignore some profiles that have weird levels .
Thanks.
Chan Joo
--------------------------------------- [ Original Message ] --------------------------------------
Sender : Ansley Manke < ansley.b.manke@xxxxxxxx >
To : Chan Joo Jang < cjjang@xxxxxxxxxxx >
CC : ferret_users < oar.pmel.ferret_users@xxxxxxxx >
Date : 2007-12-18 08:34:19
S u b j e c t : Re: [RE]Re: [want real z-axis]Re: [ferret_users] change axis
Hi Chan Joo,
Yes, I see that, but I think it's an error in the data. If we look at the original data before redefining the axes,
yes? USE/ORDER=ZT argo2900623_prof.nc
yes? shade pres
It looks to me as though the data is saved with gaps at the wrong level for L=17. It seems to me there should be missing data for levels 1 through 27 or so, then the data that's in the file, and then more missing data. I think the same thing has happened with temperature as well. (imagine sliding the data at L=17 L up and it would fit the pattern seen everywhere else).
yes? list/k=1 pres, temp
DATA SET: ./argo2900623_prof.nc
T: 0.5 to 35.5
Z: 1
Column 1: PRES is SEA PRESSURE (decibar)
Column 2: TEMP is SEA TEMPERATURE IN SITU ITS-90 SCALE (degree_Celsius)
PRES TEMP
...
13 / 13: 4.8 31.57
14 / 14: 4.6 32.10
15 / 15: 4.4 31.98
16 / 16: 4.6 32.25
17 / 17: 192.5 21.48
18 / 18: 4.9 31.09
19 / 19: 4.8 31.80
We could exclude the data for L=17, below is your script, showing how to do that. I've marked my changes with ! ** . It might be worth asking the data providers what they think about what is in the file.
By the way, if you are working with data from different sets of profiles or different experiments, and you want to compare them, you might want to define a consistent output Z axis for all data. You can define any Z axis and use it as the third argument to the ZAXREPLACE function. This axis can have any number of coordinate values. This might look like this, for example.
define axis/z/depth/units=decibars pzaxis = {1, 10, 20, 30, 50, 75, 100, 150, 200, 300, 400, 600, 1000, 1200, 1500}
let/units="`temperature,r=units`"/title="`temperature,r=title`" \
temp_on_pres=zaxreplace(temperature,z[gz=zpres],z[gz=zpres])
Here is the script, with my changes which define new varables, replacing the data at L=17 with the missing-value flag.
cancel data/all
use/order=ZT 2900623_prof.nc
!Define a time axis based on JULD
def axis/t/t0="1-jan-1950:00:00"/units=days tday=juld
!
let zz=z[gz=temp]
def axis/z/units=levels/depth zlev=zz
!
! ** Define pres_fix, excluding data at L=17.
! ** Use pres_fix in the next command defining pressure= pres_fix[...
!
let/bad=`pres,r=bad`/units="`pres,r=units`"/title="`pres,r=title`" \
pres_fix = if l eq 17 then `pres,r=bad` else pres
let/units="`pres_fix,r=units`"/title="`pres_fix,r=title`" \
pressure=pres_fix[gz=zlev@asn,gt=tday@asn]
!
! ** Define temp_fix, excluding data at L=17.
! ** Use temp_fix in the next command defining temperature= temp_fix[...
!
let/bad=`temp,r=bad`/units="`temp,r=units`"/title="`temp,r=title`" \
temp_fix = if l eq 17 then `temp,r=bad` else temp
let/units="`temp_fix,r=units`"/title="`temp_fix,r=title`" \
temperature=temp_fix[gz=zlev@asn,gt=tday@asn]
!
set vi ul
shade/vlim=1:48:-5 pres
! **
set vi ll
shade pressure
!Define an output Z axis with units of pressure, based on the data at the first time step.
def axis/z/units=decibars/depth zpres=pressure[l=1]
!
!Call zaxreplace to put the temperature data on this new pressure axis
let/units="`temperature,r=units`"/title="`temperature,r=title`" \
temp_on_pres=zaxreplace(temperature,z[gz=zpres],z[gz=zpres])
!
set vi ur
sha temp_on_pres
Chan Joo Jang wrote:
Hi Ansley,
Thanks for your prompt and detailed explanation.
I attached journal and figure files. In the figures the variable "pres" on left panel clearly shows that it has different depth values for the same level: in the figure, I added a circle mark for that.
I also found that pres in most of argo float data is time-varing.
So, I would be appreciated if you can provide the ZAXREPLACE function that can handle time-varing z-axis.
Chan Joo
Attachment:
2900622_prof.nc
Description: Binary data
Attachment:
2900622_prof_press.jpg
Description: JPEG image