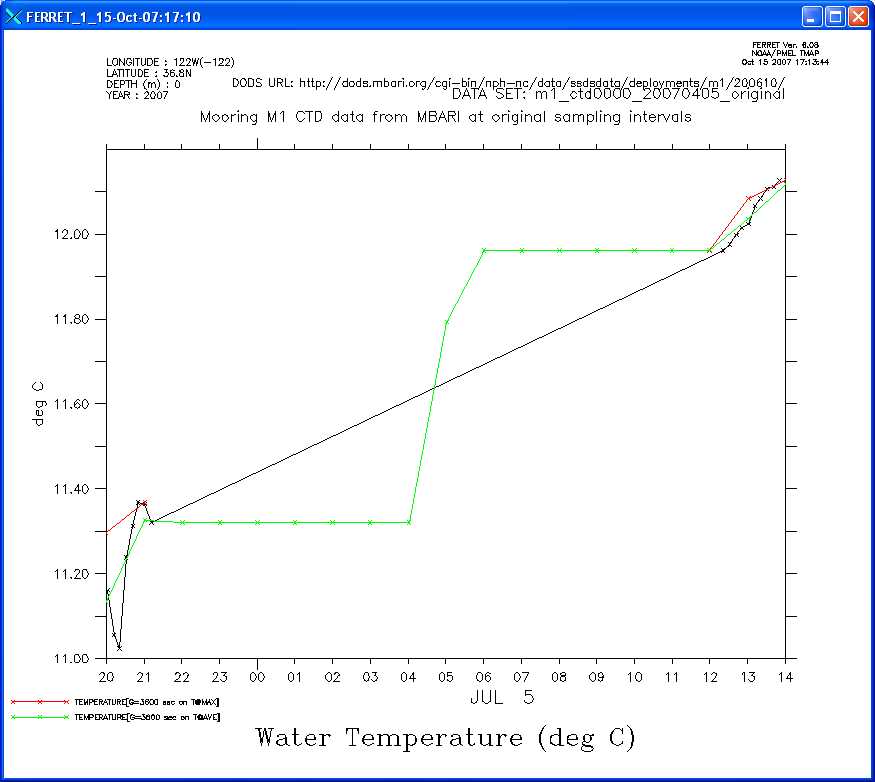
Actually, there is no bug here ... but an unexpected behavior that comes from very irregularly spaced data. There are no missing values in the input data as encoded. (See plot.) Instead there is one very long time cell for the middle portion of the plot. So the averaging algorithm is doing the right thing. See some thinking out loud at the end.
@AVE—averagingComputes the length-weighted average of all points on the source grid that lie partly or completely within each grid cell of the destination grid. If any portion of a source grid cell containing data overlaps a given destination grid cell, then data from that source cell contributes to the destination cell, weighted by the fraction of the destination cell overlapped by the source cell. The source data are treated as continuous, extending to the edges of the grid cells.
yes? plot/sym/line TEMPERATURE
yes? plot/over/sym/line TEMPERATURE[gt=HR_TIME@MAX]
yes? plot/over/sym/line TEMPERATURE[gt=HR_TIME@ave]
Worth considering whether this is "right" behavior in the abstract. Should this be considered a pathological case? Maybe the behavior of regridding by @AVE is fine but the behavior of @MAX regridding should be altered so it does not insist that there be a source point physically located inside the destination cell? On the other hand, @AVE is a weighting process, whereas @MAX is a point-picking process, so maybe it is most natural for these to behave differently as we see here.- Steve
=========================================================
McCann, Mike wrote:
Hello,

I'm use the @AVE regridding transform to take in situ mooring data and create regular hourly gridded data sets.

I've encountered a problem which I think might be a bug, namely because the @AVE and @MAX transforms behave differently.  Here is an example using an actual data set:

! An original Conductivity Temperature Depth data "10-minute" time series
USE "http://dods.mbari.org/cgi-bin/nph-nc/data/ssdsdata/deployments/m1/200610/m1_ctd0000_20070405_original.nc"

! Define an hourly axis
DEFINE AXIS/T="12-Oct-2006 18:00:00":"15-Oct-2007 18:00:00":3600/T0="01-JAN-1970 00:00:00"/UNITS=seconds HR_TIME

! Set region for when telemetry was lost for 15 hours
SET REGION/T="4-JUL-2007 20:00":"5-JUL-2007 14:00"

! Show the data to see the gap
LIST TEMPERATURE


! Grid the data with the @MAX gridding transform  This does the appropriate thing:
! finds max from input and puts in missing values for the time period of the gap.
LIST TEMPERATURE[gt=HR_TIME@MAX]

yes? LIST TEMPERATURE[gt=HR_TIME@MAX]
             VARIABLE : Water Temperature (deg C)
                        regrid: 3600 sec on T@MAX
             DATA SET : Mooring M1 CTD data from MBARI at original sampling intervals
             FILENAME : m1_ctd0000_20070405_original.nc
             FILEPATH : http://dods.mbari.org/cgi-bin/nph-nc/data/ssdsdata/deployments/m1/200610/
             SUBSET   : 19 points (TIME)
             LONGITUDE: 122W(-122)
             LATITUDE : 36.8N
             DEPTH (m): 0
                            122W
                              1
 04-JUL-2007 20:00 / 6363:  11.30
 04-JUL-2007 21:00 / 6364:  11.37
 04-JUL-2007 22:00 / 6365:   ....
 04-JUL-2007 23:00 / 6366:   ....
 05-JUL-2007 00:00 / 6367:   ....
 05-JUL-2007 01:00 / 6368:   ....
 05-JUL-2007 02:00 / 6369:   ....
 05-JUL-2007 03:00 / 6370:   ....
 05-JUL-2007 04:00 / 6371:   ....
 05-JUL-2007 05:00 / 6372:   ....
 05-JUL-2007 06:00 / 6373:   ....
 05-JUL-2007 07:00 / 6374:   ....
 05-JUL-2007 08:00 / 6375:   ....
 05-JUL-2007 09:00 / 6376:   ....
 05-JUL-2007 10:00 / 6377:   ....
 05-JUL-2007 11:00 / 6378:   ....
 05-JUL-2007 12:00 / 6379:  11.96
 05-JUL-2007 13:00 / 6380:  12.08
 05-JUL-2007 14:00 / 6381:  12.13


! Grid the data with the @AVE gridding transform.  This does an unexpected thing:
! fills the time period of the gap with numbers that are extrapolations of bounding
! good points except for the center point which is an average of those two points.
LIST TEMPERATURE[gt=HR_TIME@AVE]

yes? LIST TEMPERATURE[gt=HR_TIME@AVE]
             VARIABLE : Water Temperature (deg C)
                        regrid: 3600 sec on T@AVE
             DATA SET : Mooring M1 CTD data from MBARI at original sampling intervals
             FILENAME : m1_ctd0000_20070405_original.nc
             FILEPATH : http://dods.mbari.org/cgi-bin/nph-nc/data/ssdsdata/deployments/m1/200610/
             SUBSET   : 19 points (TIME)
             LONGITUDE: 122W(-122)
             LATITUDE : 36.8N
             DEPTH (m): 0
                            122W
                              1
 04-JUL-2007 20:00 / 6363:  11.13
 04-JUL-2007 21:00 / 6364:  11.33
 04-JUL-2007 22:00 / 6365:  11.32
 04-JUL-2007 23:00 / 6366:  11.32
 05-JUL-2007 00:00 / 6367:  11.32
 05-JUL-2007 01:00 / 6368:  11.32
 05-JUL-2007 02:00 / 6369:  11.32
 05-JUL-2007 03:00 / 6370:  11.32
 05-JUL-2007 04:00 / 6371:  11.32
 05-JUL-2007 05:00 / 6372:  11.79
 05-JUL-2007 06:00 / 6373:  11.96
 05-JUL-2007 07:00 / 6374:  11.96
 05-JUL-2007 08:00 / 6375:  11.96
 05-JUL-2007 09:00 / 6376:  11.96
 05-JUL-2007 10:00 / 6377:  11.96
 05-JUL-2007 11:00 / 6378:  11.96
 05-JUL-2007 12:00 / 6379:  11.96
 05-JUL-2007 13:00 / 6380:  12.04
 05-JUL-2007 14:00 / 6381:  12.12


Am I interpreting these transforms properly?  Should @AVE have a behavior similar to @MAX (and @MIN)?  I'd think that if there were no data for a time period then that should be reflected with missing data values for whatever gridding transform is used.

Thanks,
Mike

--
Mike McCann
Software Engineer
Monterey Bay Aquarium Research Institute
7700 Sandholdt Road
Moss Landing, CA 95039-9644
Voice: 831.775.1769  Fax: 831.775.1736 http://www.mbari.org <http://www.mbari.org/>
--
Steve Hankin, NOAA/PMEL -- Steven.C.Hankin@xxxxxxxx
7600 Sand Point Way NE, Seattle, WA 98115-0070
ph. (206) 526-6080, FAX (206) 526-6744

"The only thing necessary for the triumph of evil is for good men
to do nothing." -- Edmund Burke