[Thread Prev][Thread Next][Index]
[ferret_users] Generating a "ternary diagram" or "triangular plot"
Hello All,
Some time ago I saw a plot used in a geologic context to represent
mixtures of three components. Then recently I came across a situation
where it might be useful in my own work. It turned out to be quite easy
to generate such a plot in Ferret so I thought I'd share it. Perhaps it
has been done by others but I haven't noticed it in the user group email.
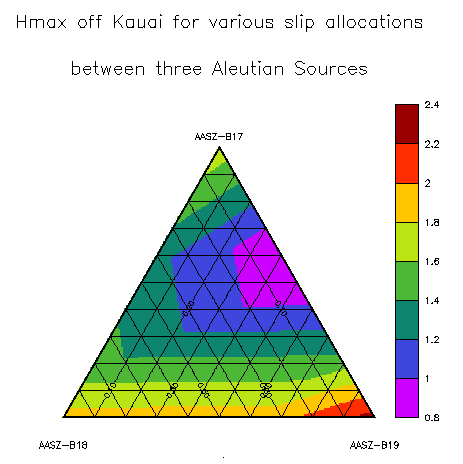
The attached graphic illustrates the result: tsunami wave trains
from three modeled sources can arrive at a coastal site. If there is a
certain amount of earthquake energy to be distributed between the three
sources, what linear combination of the wave trains causes the greatest
wave at the impact site?
So with three time series HA[l=1:1440], HB[l=1:1440],HC[l=1:1440]
define fractions FA,FB,FC that sum to 1 (or some other appropriate
constant). FA is maximum at its vertex and decreases to zero at the
opposite side of the triangle, and likewise for the other vertices. Define
let COMBO = FA*HA + FB*HB + FC*HC
go TernaryDiagram ! to generate FA,FB,FC in a
triangular layout
      shade/nolab combo[L=@max]
!(and if the triangular grid lines and frame are desired)
      cont/o/nolab/set fa ; ppl pen,1,1 ; contour/over
      cont/o/nolab/set fa ; ppl pen,1,1 ; contour/over
      cont/o/nolab/set fa ; ppl pen,1,1 ; contour/over
      plot/o/nolab/vs/line=7 {0,2,1,0},{0,0,`root3`,0}
and the result shows that if all the energy is allocated to B19 can
generate the biggest wave at the impact site; linear combinations of B19
and B18 are quite effective but waves from B19 and B17 must arrive quite
a bit out of phase so that the amplitude of their combination is
substantially reduced.
The script TernaryDiagram.jnl is attached and may find use in other
hands.
Regards,
   Mick

! TernaryDiagram : plotting mixtures of 3 variables in a triangular/ternary diagram
!
! define horizontal and vertical axes on which to draw triangle (2 wide;root3 high)
!
!             A (1,root3)
!           / | \             A point P lies at the intersection of three lines
!          /  |/ \            that are parallel to the sides of the triangle ABC.
!         /   /   \           The fractions Fa, Fb, Fc at P are the fractional
!        /   /|    \          distances of each of these lines from its vertex,
!       /   / |     \         with 100% at the vertex and 0% at the opposite side.
!      / \ /  |      \        With vertices drawn as shown and P=(x,y):
!     /---P---|-------\              Fa = y/root3
!    /   / \  |        \             Fb = 1 - x'/root3, x'=xcos30-ysin30
!   B___/___\_|_________C            Fc = 1-Fa-Fb
! (0,0)               (2,0)   A triangular mask for the region is defined by:
!                                      if(y < root3*(1-abs(x-1))then 1

! choose a suitable resolution to represent the region
let root3=3^0.5 ; def axis/y=0:2/npoints=201 yax
def axis/x=0:2/npoints=201 xax ; def grid/x=xax/y=yax grd

let mask=if(y[g=grd] le root3*(1-abs(x[g=grd]-1)))then 1
let Fa=mask*y[g=grd]/root3
let Fb=1-0.5*mask*(x[g=grd]+y[g=grd]/root3)
let Fc=1-Fa-Fb

! demo plot - first fix aspect ratio and turn off axes
ppl axlen,5,5 ; ppl axset,0,0,0,0
! ... then shade Fa and add Fb, Fd as contours
shade/nolab Fa ; cont/o/nolab/spacing=0.8 Fb ; cont/o/nolab/spacing=0.8 Fc
! add frame and vertex labels
plot/o/nolab/vs/line=7 {0,2,1,0},{0,0,`root3`,0}
label  1.0 `root3+0.05` 0 0 0.2 A
label -0.1    0        -1 0 0.2 B
label  2.1    0         1 0 0.2 C

quit
[Thread Prev][Thread Next][Index]
Contact Us
Dept of Commerce /
NOAA /
OAR /
PMEL /
TMAP
Privacy Policy | Disclaimer | Accessibility Statement
