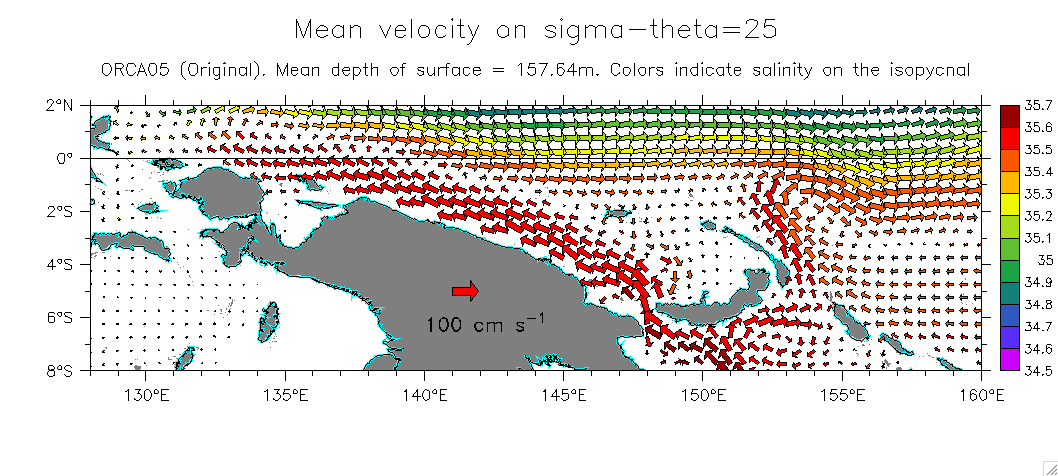
Dear Ferreters -Several versions of scripts to plot color-filled vectors have turned up on this list over the years, written originally by Ned Cokelet and modified by myself. This message gives yet another one, but I think this one is really the best way to do it. I have attached an example plot showing velocity and salinity on an isopycnal in the western equatorial Pacific from an OGCM. The advantage of the script is in visualizing multiple variables in a single plot, and seeing the relationship among them. The vectors are scaled so the area of the vector (not the length) scales by its magnitude, which I think is appropriate for such filled vectors.
Billy KThere are comments at the top of the attached script (poly_vectors_scaled_arrows_area.jnl), but it might be useful to see the commands used to make the above plot.
There were 7 steps to using the script, shown schematically as follows:

 1) find u, v, and salt on isopycnals
define axis/z=23:28:.5 axden
let u_on_sigma=zaxreplace(u,sigma,z[gz=axden])
let v_on_sigma=zaxreplace(v,sigma,z[gz=axden])
let s_on_sigma=zaxreplace(salt,sigma,z[gz=axden])

 2) draw a basemap (essential; the vector script must be an overlay)
In this step it is also essential to use the correct aspect ratio for the plot,
     or else the vectors will not be correctly oriented
set win/asp=.45     ! for 32 deg lon by 10 deg lat
shade/set/nolab/nokey/x=128e:160e/y=8s:2n/hli=128e:160e:5/vli=8s:2n:2/
lev=(0,10000,10000,-3)/pal=gray rose[d=etopo02]
ppl yfor,(i5,''lat'')
ppl shade
3) define the positions (x_vec,y_vec) and values (u_comp,v_comp) of the vectors note that x,y_vec are defined to include values on the complete (x,y) grid: x+0*y, 0*x+y)
let x_vec = x[gx=u_on_sigma,x=128e:160e] + 0*y[gy=u_on_sigma,y=8s:2n]
let y_vec = 0*x[gx=u_on_sigma,x=128e:160e] + y[gy=u_on_sigma,y=8s:2n]
let u_comp = u_on_sigma[z=25,x=128e:160e,y=8s:2n]
let v_comp = v_on_sigma[z=25,x=128e:160e,y=8s:2n]

 4)  call the filled vector script (choosing scale length 100)
go poly_vectors_scaled_arrows_area.jnl x_vec y_vec u_comp v_comp 100 "arrow"
5) define the value of the variable to be filled (using ysequence to make it a list along the y-axis)
let saltseq = ysequence(s_on_sigma[z=25,x=128e:160e,y=8s:2n])

6) use POLYGON to actually draw the vectors
(plt_x_arrow, plt_y_arrow are the outputs of the filled vector script in step 4) polygon/over/nolab/key/lev=(34.5,35.7,.1,1)/pal=default/line plt_x_arrow, plt_y_arrow, saltseq
7) make a scale vector using the same script and call to POLYGONin this case there is only a single value for each and they are just written out using { } notation let x_vec={141}; let y_vec={-5}; let u_comp={100}; let v_comp={0}; let mag={1} go poly_vectors_scaled_arrows_area.jnl x_vec y_vec u_comp v_comp 100 "arrow" polygon/over/nolab/nokey/lev=(0,1000,1000)/pal=red/LINE plt_x_arrow, plt_y_arrow, mag
label 140 -6.5 -1 0 .18 @dr100 cm s^-^1
Attachment:
poly_vectors_scaled_arrows_area.jnl
Description: Binary data