[Thread Prev][Thread Next][Index]
[ferret_users] shade: a cross section with the surface topography filled at thebottom?
Dear Ferret users,
I looked at the online help, found some clues to help me, but I
haven't succeeded so far and thought of submitting my question to you.
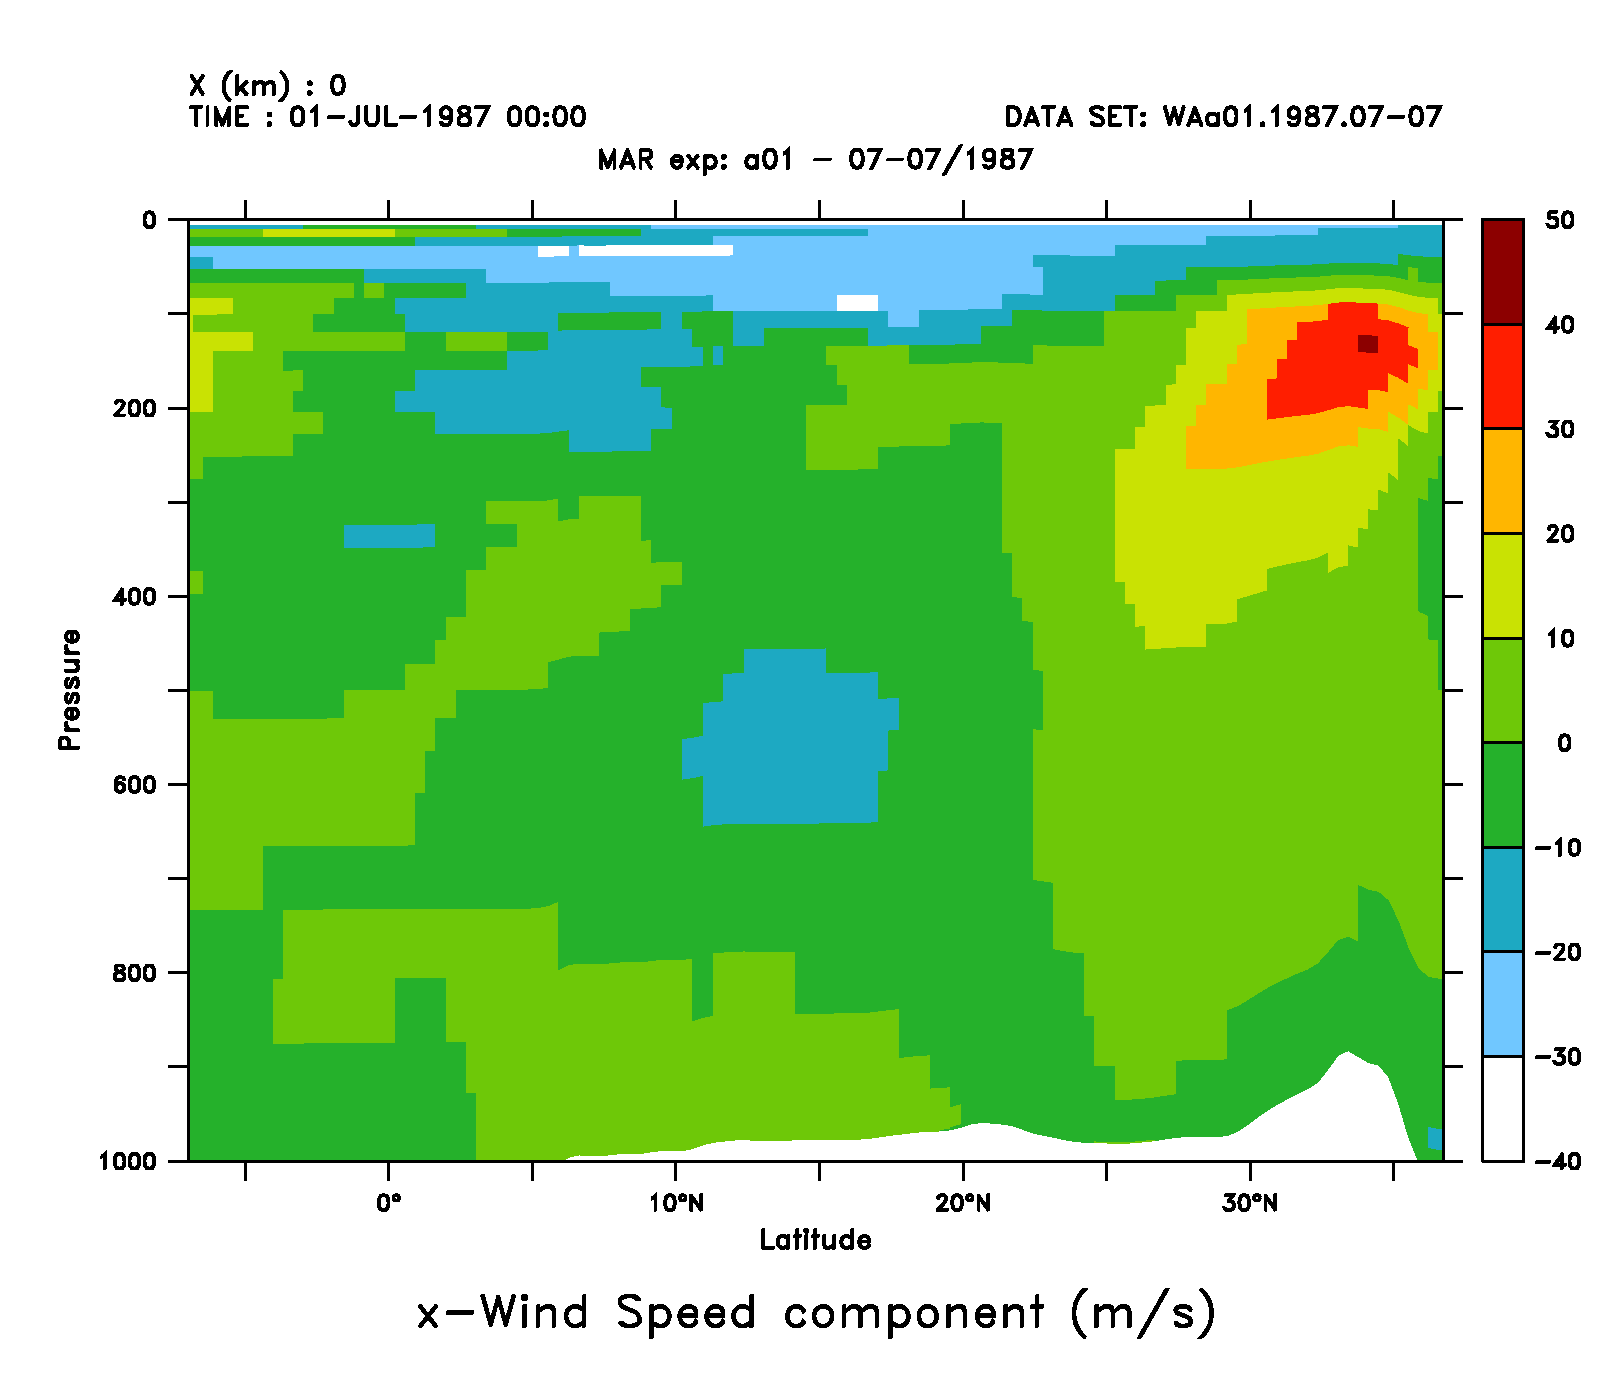
I plot a cross section of the zonal wind with a simple "shade/x=0/l=1/
vlimit=1000:0:-100 uairdy,lat,pressure". The resulting graph is
joined to this email.
How can I get the imitation of the surface topography (the white
area) shaded in grey or black or whatever colour?
In the sigma_coordinate_demo.jnl script, some similar graphs are made
and obviously succeeded where I fail. But the problem is taken
backwards: first the topography is defined (variable "bathymetry"),
then the variable is computed, then the variable is plotted, then the
bathymetry is overlayed.
How can I compute the surface topography from my data? I can get the
value of the pressure at the surface, but I haven't succeeded to make
it 3D "under the surface" and even less to plot it nicely.
Would anybody know how to do?
Many thanks in advance,
Emilie
[Thread Prev][Thread Next][Index]
Dept of Commerce /
NOAA /
OAR /
PMEL /
TMAP
Contact Us | Privacy Policy | Disclaimer | Accessibility Statement