[Thread Prev][Thread Next][Index]
Re: [ferret_users] Multi variable bar chart
Hi Jagadish,
I usually use polygon for various bar chart applications and this
one seems like a natural. The
general idea is that if xx and yy are the horizontal position and height
of the bar then
polygon/pal=.../line=.../coord=... xx+bx , yy*by
makes the bars. Here the ADDED bx defines the horizontal coords of the
bar, and the FACTOR by={0,0,1,1} anchors the bar.
For multiple variables you can define more than one "bx" to divide up
the interval associated with each time or horizontal axis step. Its
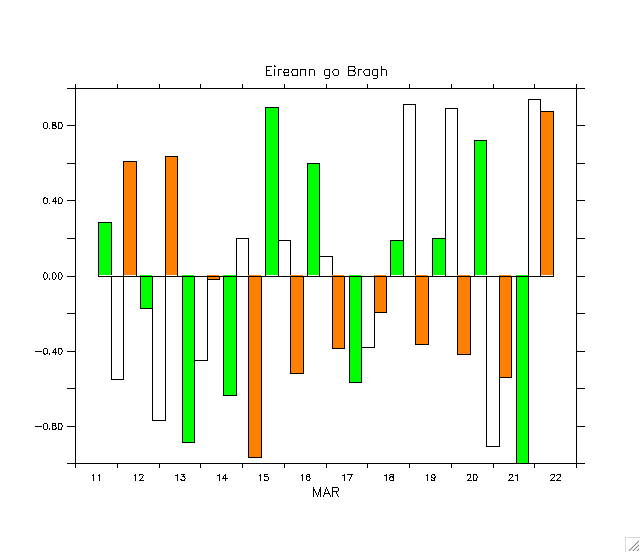
easiest to illustrate with an example - here is one with three variables
and the image is attached.
The same idea works for horizontal bars or, with
by=zsequence({-1,-1,1,1}) for error bars. You can of course color the
bars with some third variable rather than use single colors.
Good luck,
Mick
!-----------------------------------------------------------------------------------------------
! 1-May-06 07:00 a triple barchart
! define three variables along a time axis
def axis/t=12-mar-2006:22-mar-2006:1/units=days tax
def grid/t=tax grd
let xx=t[g=grd]
let yy1=2*(randu(xx+1)-0.5) ; let yy2=2*(randu(xx+2)-0.5) ; let
yy3=2*(randu(xx+3)-0.5)
! define the bars (along another axis than t)
let bx1=zsequence({-0.45,-0.15,-0.15,-0.45})
let bx2=zsequence({-0.15,0.15,0.15,-0.15})
let bx3=zsequence({0.15,0.45,0.45,0.15})
let by=zsequence({0,0,1,1})
! first draw a fake plot to stretch the time axis a little ...
plot/nolab/vlim=-1:1/hlim=`xx[l=@min]-1`:`xx[l=@max]+1` xx-xx
! ... then overlay the bars
polygon/over/nolab/pal=green/line=1/coord=z xx+bx1,yy1*by
polygon/over/nolab/pal=white/line=1/coord=z xx+bx2,yy2*by
polygon/over/nolab/pal=orange/line=1/coord=z xx+bx3,yy3*by
label/nouser 4 6.2 0 0 0.15 Eireann go Bragh
frame/file=LaFeilePadraig.gif
!---------------------------------------------------------------------------------------------------
Dear Ferret users,
I want to plot bar chart with 2 or more variable similar to that in
the attached figure. Use of overlay option in go bar_chart3 just over
lay bar of other variable on the top of 1st bar. I want to place them
side by side. Also can be have some control over the width and
seperation of the bars?
Thanking in advance
Jagadish
------------------------------------------------------------------------
Love cheap thrills? Enjoy PC-to-Phone calls to 30+ countries
<http://us.rd.yahoo.com/mail_us/taglines/postman9/*http://us.rd.yahoo.com/evt=39666/*http://messenger.yahoo.com/>
for just 2¢/min with Yahoo! Messenger with Voice.
------------------------------------------------------------------------

[Thread Prev][Thread Next][Index]
Dept of Commerce /
NOAA /
OAR /
PMEL /
TMAP
Contact Us | Privacy Policy | Disclaimer | Accessibility Statement
