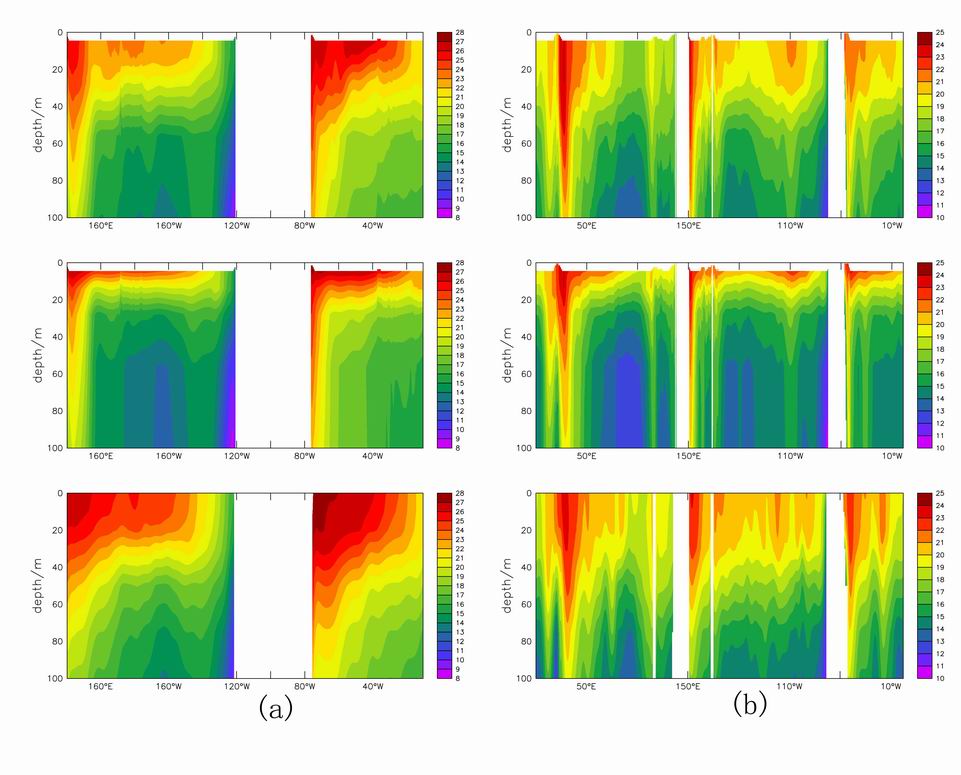
Dear ferreters,

 I use the command
  ppl tics ,,,,1,1
  set the tics inside the graph, then fill a graph,
  the filled gprah covers the tics,see the attached jpg file,
Does anyone knows how to slove the problem and let the tics show up in the filled area?

Happy ferreting!


Dr. Changshui Xia
Assistant Research Scientist
The First Institute of Oceanography, State Oceanic Administration
6 Xian-Xia-Ling Road, Hi-Tech Industry Park
Qingdao, Shandong 266061, P.R. China
Tel: +86-532-88968301
Fax: +86-532-88968301
Attachment:
fill_cover_tics.jpg
Description: JPEG image