The arrows on the flowline curves are scaled relative to the mean velocity of the arrows, so there is not now a good way to control them. This is already on our list of bugs to fix. The /LENGTH qualifier could be used to change the arrow head sizes, just as it changes the arrow lengths for the regular VECTOR command. I think that this is the real trouble with your particular data. I'll see if we can get this small change into the next release of Ferret.
The /XSKIP and /YSKIP qualifiers are not used when we specify VECTOR/FLOWLINE. The /DENSITY qualifier is intended to do this, where DENSITY is a positive integer ( I have added this fact to the Users Guide.) In general, numbers like /DENSITY=2 gets you fewer curves than the default, and /DENSITY=8 and higher gives you more. /DENSITY=2, 3, 4 may all look the same. The algorithm depends on the data and its grid. You can also send subsampled data to the command, but the flowline algorithm seems to try to fill in and make more flowline curves, especially around the edges. Compare
yes? use monthly_navy_winds
yes? set region/L=50/y=-80:80
yes? vector/flow uwnd[i=1:144:4,j=1:73:4], vwnd[i=1:144:4,j=1:73:4]
yes? vector/flow/DENSITY=2 uwnd, vwnd
yes? vector/flow/DENSITY=8 uwnd, vwnd
I would recommend staying with the DENSITY qualifier.
Emilie Vanvyve wrote:
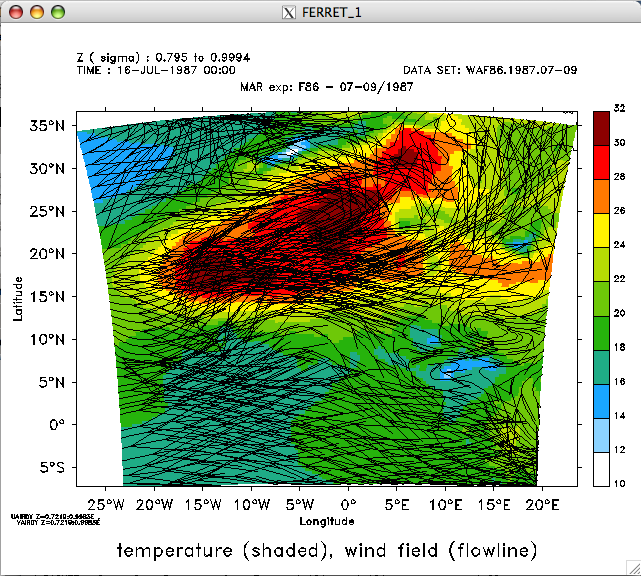
Hi everyone,

I have a question about the use of the command "VECTOR/flowline".
With something as simple as this:

shade temperature,lon,lat
vector/overlay/flowline u,v,lon,lat

I have been trying to draw a 2D wind field over a 2D temperature field, without any success
so far apart from loosing hair.
The temperature is just plotted with SHADE. The wind field is drawn from the variables u and
v and I want it to appear as a flow line instead of the well known arrows.
The latter is the tricky part: I can easily get the flow lines, but I can not decrease the number
of drawn flowlines. They are so many that the graphic is not legible at all (see attached
screen capture which is the best i could get so far).

Until now, I have tried:
- the "/density=..." qualifier. The bigger the number, the more numberous the flow lines are.
The best I could get is with a decimal number (any of them) between 0.1 and 0.9. Negative
numbers are not of any help.
- the "/xskip=.../yskip=..." qualifiers. Except if the wind field is drawn as arrows instead of
flowlines, it doesn't change anything to the graph. I even tried the "pplus/...,xskip,yskip"
formula, unsuccessfully.
- the "/length=..." qualifier. That doesn't work.
- different amusing combinations of all possible qualifiers, without any success.
- a different way to give my variables u and v. I indicated u
[x=-1000:1000:100,y=-1000:1000:100] (units=km), idem for v, hoping Ferret would be
forced to use only a sample of u and v, but that didn't work either.

Does anyone have a solution for that?
By the way, I couldn't reduce the size of the arrows drawn on the flowline, any hint about this
would be very welcomed too!

Thanks in advance for any help,

Emilie


P.S.: I am using Ferret v5.81 on a Linux(g77) 2.4.18, according to the Ferret header.