[Thread Prev][Thread Next][Index]
Re: [ferret_users]:how to add a grid on a plot
Hi Xavier,
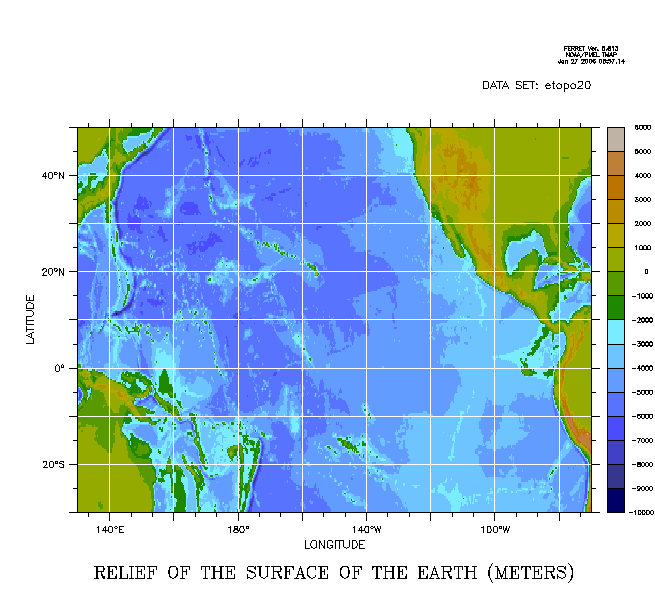
There are newer plot qualifiers that let you add lines across the plot
at the locations of the tic marks on the axis. The /GRATICULE
qualifier for all plot commands let you control the color and line type
- solid or dash - of these lines.
To see some of the options, try the script
yes? go graticules_demo
Ansley
Xavier Couvelard wrote:
Hi,
is it possible to add a grid on plot (fill) to check exact coord of a
value
thanks

[Thread Prev][Thread Next][Index]
Dept of Commerce /
NOAA /
OAR /
PMEL /
TMAP
Contact Us | Privacy Policy | Disclaimer | Accessibility Statement
