[Thread Prev][Thread Next][Index]
[ferret_users] Use of legline.jnl on time axis
Hi,

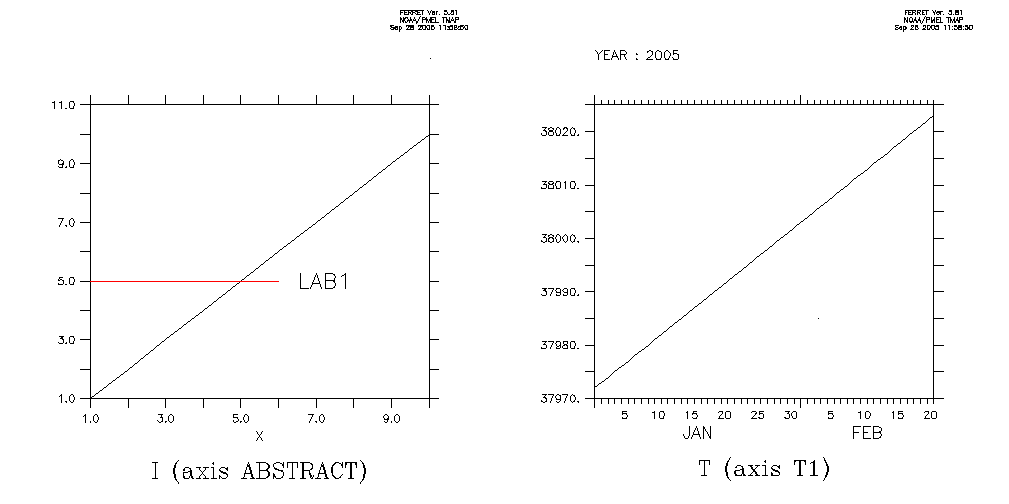
What's the trick to make legline work with a time-series plot ?
Here is a test script and the results to illustrate the problem:
------------------------------------------------------------
def ax/t=1-jan-2005:21-feb-2005:1/unit=day t1

set win/asp=0.5
set viewp left
plot/i=1:10 i
go legline 1 5 5 2 0.2 LAB1
set view right
plot t[gt=t1]
go legline `t[gt=t1,t=1-jan-2005]` 5 37990 2 0.2 LAB1

frame/file=legline_test.gif
------------------------------------------------------------

Best regards,
Paulo

 ! NOAA/PMEL TMAP
 ! FERRET v5.81
 ! Linux(g77) 2.4.21-32 - 07/13/05
 ! 27-Sep-05 19:57

def ax/t=1-jan-2005:21-feb-2005:1/unit=day t1

set win/asp=0.5

set viewp left
 plot/i=1:10 i
 go legline 1 5 5 2 0.2 LAB1

set view right
 plot t[gt=t1]
 go legline `t[gt=t1,t=1-jan-2005]` 5 37990 2 0.2 LAB1

frame/file=legline_test.gif

quit
[Thread Prev][Thread Next][Index]
Dept of Commerce /
NOAA /
OAR /
PMEL /
TMAP
Contact Us | Privacy Policy | Disclaimer | Accessibility Statement
