Thanks for your quick response.
I have installed Adobe Illustrator. But i have no idea how to use it. Would you like to give me some detailed hints?
Best wishes,
Gao
Hi Gao
So many problem little problems like changing line thickness are trivial in Adobe Illustrator. Why not just make your plot in ferret, then read it into Adobe Illustrator (if you have this software) and modify it as you see fit?
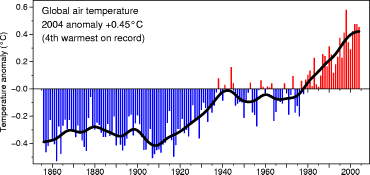
Regarding histogram plot: (These are actually more generally called bar charts or bar graphs, although your confusion is very understandable because the more narrowly defined histograms (like a discrete version of probability density) are almost always drawn as bar charts.)
Ferret v5.6 has a few go files, bar_chart1, bar_chart2, and bar_chart3.
Best wishes,
Rob
At 07:43 AM 6/30/2005, Gao Rongzhen wrote:
Hi, allRob Scott
Here i have two questions.
One is about command Fprint. I looked through the email archives, but still have no idea to change thin lines in PS files to thicker ones. When i use Fprint i am informed no command. I wonder know how to use Fprint and under what conditions to use it? The ferret version i'm using is 5.53, on windows 98.
Are there any other ways to get thick lines output besides the above method?
The other one is wether ferret can get the following histogram plot, and how? I want to plot histogram instead of line.
<?xml:namespace prefix = v ns = "urn:schemas-microsoft-com:vml" />
Thanks
Gao Rongzhen
Research Associate
Institute for Geophysics
University of Texas at Austin
4412 Spicewood Springs Rd.
Building 600
Austin, TX
78759
Office: +1-512-471-0375
