It all depends on how the data is arranged in the ASCII file. The way you've set up the grid and the FILE command, Ferret expects the data to be listed with one value per record, with X varying fastest. So, the commands you have set up expect this in the ascii file:
r(x1,y1)
r(x2,y1)
r(x3,y1)
...
r(xn,y1)
r(x1,y2)
r(x2,y2)
...
r(xn,y2)
r(x1,y3)
r(x2,y3)
...
If your data is arranged differently, then you need different commands. See "ascii data, accessing" in the Users Guide.
Steve Guimond wrote:
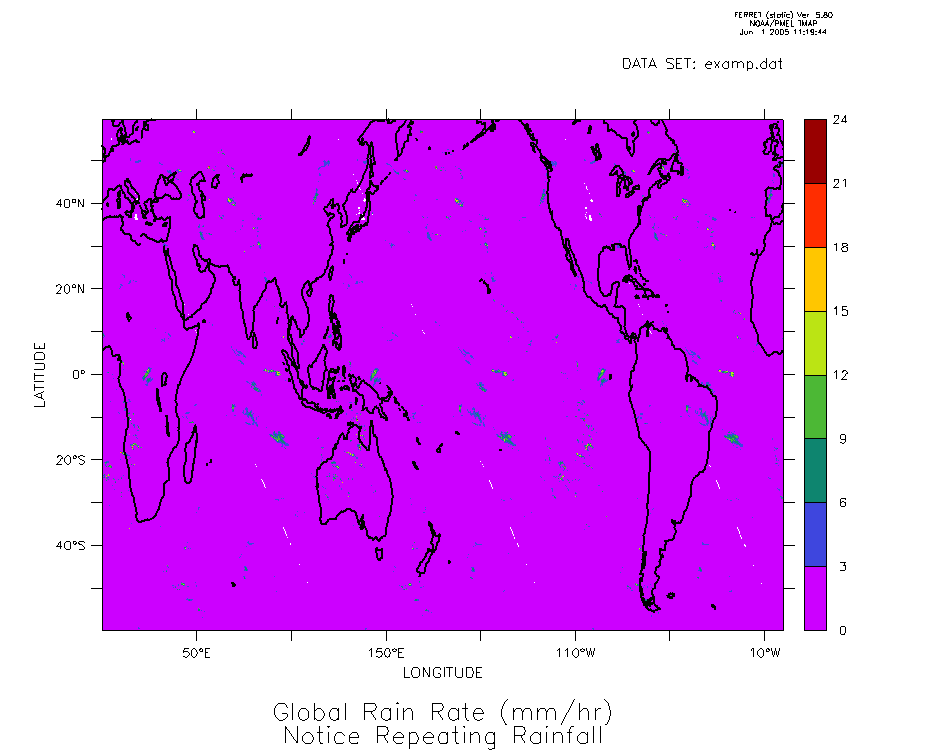
Hello:
   I am having troubles plotting satellite derived rain rate data from
NASA.  When I plot the data, there are three distinct "swaths" that
repeat across the global domain.  I checked the values from the file and
they do not repeat, so it must be in the way I have set the grid for the
data.  I have attached the plot so you can see what I am referring to.
The data has 0.25 deg resolution with 1440x480 points (0-360 deg. E and
60N-60S).  The first grid box center is at (0.125 deg. E,59.875 deg. N).
The code I used to make the plot is as follows:


define axis/x=0.125E:359.875W:0.25/units=deg lon
define axis/y=59.875N:59.875S:0.25/units=deg lat
define grid/x=lon/y=lat mygrid
file/var=rr/grid=mygrid test.dat               !reading in ASCII file
data to define grid
fill/levels=(0,25,3) rr

Thanks for any help


Stephen R. Guimond
Graduate Research Assistant
Center for Ocean-Atmospheric Prediction Studies