[Thread Prev][Thread Next][Index]
Script to find and plot variance ellipses
Hi Ferret users -

Here is a ferret script I wrote to find and plot variance ellipses of vector timeseries. I hope you
find it useful.

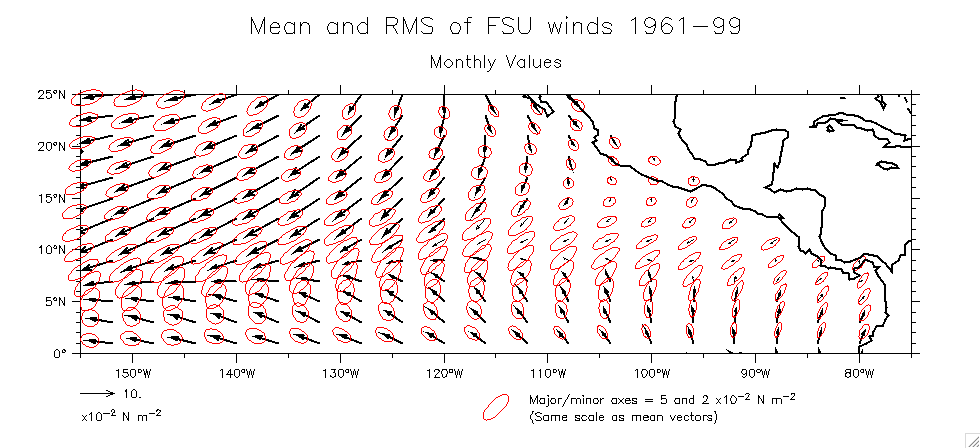
Variance ellipses show the 1 standard deviation variability of vectors about their mean. It is a
useful way to plot the variability of both the magnitude and direction of vectors. Please look at
the first attached figure, which shows the mean FSU wind vectors in the eastern tropical Pacific and
their variance ellipses. Over time, each vector's head wanders within the ellipse. Some vectors vary
mostly in magnitude (e.g. the ellipse elongated in the vector direction at 11N,140W), and others
mostly in direction (e.g. the ellipse elongated across the vector direction at 7N,120W).

Note that the ellipse is not necessarily oriented along the vector direction, but is rotated to the
principal components of the variability (thus expressing the variability in its most compact form).
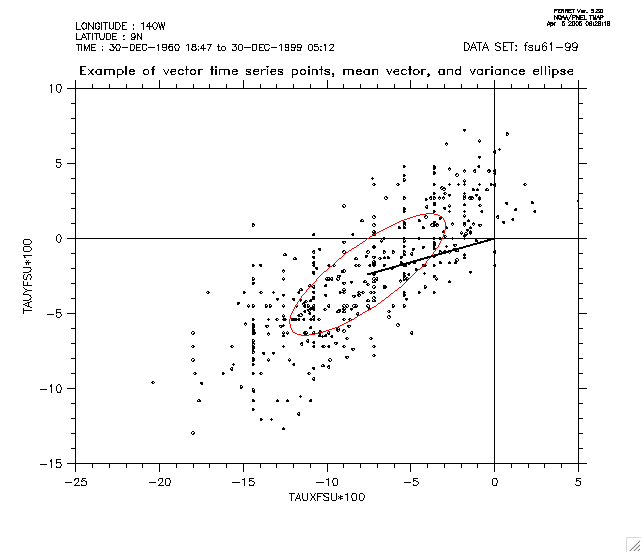
See the second attached figure, which shows as an example the cloud of vector points at 9N, 140W,
the mean vector, and the variance ellipse. The major and minor axes of the ellipse are the EOFs of
the time series of (Taux,Tauy) at 9N,140W.

To use the script on your data, edit the parameters contained within the starred lines near the
start of the script. There are a relatively large number of things to edit, but that is necessary to
make the script flexible enough for general vector time series. The script as attached made the
first figure, which might help in seeing how to choose the various parameters. The script plots the
"significant" vectors (magnitude larger than the variance ellipse) as heavy lines, and the rest as
light lines (see the first figure).

Hopefully I haven't made any mistakes!

Billy K


! make variance ellipses overlaid on mean vectors
! mean vectors and variance ellipses are scaled the same
! ellipse is oriented along the axis of largest variance (Preisendorfer, Chap 2)
! plots "significant" vectors (that extend outside the ellipse) thicker

! the script makes 3 plots successively, of which only the last is of interest
! this is necessary to make the aspect ratio of the plot consistent with the
!    range of the data. The correct aspect ratio is essential to make the
!    shape of the ellipses meaningful.
! the problem is the need to convert data units to inches so as to scale the
!    ellipses correctly, and the symbols ($xaxis_max) etc are only available
!    after a plot has been made.

! this script requires that the data grid has a free z axis!
! it assumes that the data grid is (x,y,t)

! note for publication-quality plots: The thicker "significant" vectors
! produced by this script are fine for gifs, but are not thick enough when
! converted to postscript (Fprint). To fix this, make your postscript, then
! bring it up in a text editor. There will be 2 lines "2.000000 lw". Change
! the first of these to "5.000000 lw". The resulting vectors will print well
! in postscript or pdf.

! if you use this script in a publication,
! please credit William S. Kessler, NOAA/PMEL

! --->>> edit the section within the stars just below:
! *********************************************************************
! values that must be chosen (edit here):

use "/kdata/kessler/fsu/fsu61-99.cdf"	! choose data set

! names for variables.
define symbol fvar tauxfsu		! name of file variable (to get grid)
define symbol pvar1 tauxfsu		! name of working variable 1
define symbol pvar2 tauyfsu		! name of working variable 2

! choose scaling factors and other data-specific values
define symbol l1 1			! first time gridpoint to use
define symbol lf 456			! final time gridpoint to use
define symbol xskp 2			! vector xskip argument
define symbol yskp 1			! vector yskip argument
define symbol vscl 100			! data unit scale (plot data*($vscl))
define symbol unitlab "x10^-^2 N m^-^2"	! units of scaled data (for label)
define symbol vlen 10			! vector length scale (also ellipses)
define symbol ste1 .05			! major axis of scale ellipse (data
define symbol ste2 .02			! minor axis of scale ellipse  units)
! the last 2 only describe the scale ellipse key, in (unscaled) data units

! choose axis limits
define symbol axlim "xli=155w:75w:10/yli=0:25n:5"

! choose data (i,j) limits for ellipse plotting
! this allows ellipses to extend outside the plotting frame (ppl window,off)
! this gives control over ellipses appearing at the edge of the viewport
!     but the start/end values must be consistent with symbol axlim above!
! a mindless first-look choice is to set these to grid mins/maxs,
!     and comment out "ppl window,off" below. This will take a lot more time.
define symbol i1 43			! start of i repeat loop
define symbol i2 84			! end of i repeat loop
define symbol j1 16			! start of j repeat loop
define symbol j2 28			! end of j repeat loop

! title text labels
define symbol main_title "FSU winds 1961-99"
define symbol title_subhead "Monthly Values"

! axis labeling/ticking parameters and vector key label format
define symbol axlint_axnmtc "ppl axlint,1,1;ppl axnmtc,1,4"
define symbol veckey_format "(f3.0)"
! *********************************************************************

! make a dummy plot to get xlen and ylen
vector/($axlim)/len=($vlen) ($pvar1)[l=1]*($vscl),($pvar2)[l=1]*($vscl)

define symbol xdeg `($xaxis_max)-($xaxis_min)`
define symbol ydeg `($yaxis_max)-($yaxis_min)`
define symbol alasp `($ydeg)/($xdeg)`

! now set correct aspect ratio and make second dummy plot
!    to get the axis length in inches.
! this is really stupid. Probably it would be better to just
!    set these things by hand above
set win/asp=($alasp):axis
vector/($axlim)/len=($vlen) ($pvar1)[l=1]*($vscl),($pvar2)[l=1]*($vscl)

define symbol xxlen `($ppl$xlen)`
define symbol yylen `($ppl$ylen)`

! these define the conversion from plot inches to lat/lon
define symbol degpinx `($xdeg)/($xxlen)`
define symbol degpiny `($ydeg)/($yylen)`
say ($degpinx) ($degpiny)
mess/q/cont The above values (inches/degree lat/lon) should be identical

! thus get the conversion from data units to half-inch standard vector length
define symbol duhi `($degpinx)/(2*($vlen))`

! end of dummy plotting
! ----------------------------------------------------------------------
! make variances and covariance
let/q xbar = ($pvar1)[l=($l1):($lf)@ave]
let/q ybar = ($pvar2)[l=($l1):($lf)@ave]
let/q txdm = ($pvar1)-xbar
let/q tydm = ($pvar2)-ybar
let/q xsq = txdm^2
let/q ysq = tydm^2
let/q xy = txdm*tydm

let/q syy = ysq[l=($l1):($lf)@ave]
let/q sxx = xsq[l=($l1):($lf)@ave]
let/q sxy = xy[l=($l1):($lf)@ave]

! make ellipse parameters
! thetam is the variance ellipse rotation (principal angle). clockwise. (P2.9)
let/q thetam = (-1)*0.5*atan2(2*sxy,sxx-syy)

! major and minor axes of ellipse (P2.12)
let/q amaj = (0.5*(sxx+syy+((sxx-syy)^2 +4*sxy^2)^.5 ))^.5
let/q bmin = (0.5*(sxx+syy-((sxx-syy)^2 +4*sxy^2)^.5 ))^.5

! construct the ellipse in 37 segments
! must have a free z-axis
let/q pi = 4*atan(1)
define axis/z=1:361:10 zphi
let/q rad = z[gz=zphi]*pi/180

! ellipse points in the rotated reference frame
let/q xell = amaj*cos(rad)*($vscl)
let/q yell = bmin*sin(rad)*($vscl)

! ellipse points in the longitude/latitude frame (rotate by thetam)
! this ellipse is in units of scaled data ($vscl)
let/q xellp = xell*cos(thetam) + yell*cos(thetam-pi/2)
let/q yellp = xell*cos(thetam+pi/2) + yell*cos(thetam)

! Now scale to lat/long units for overplotting on the map
let/q xellpsc = if xellp then xellp * ($duhi) else 0
let/q yellpsc = if yellp then yellp * ($duhi) else 0

! place in correct location on map
! place ellipse around vector head!
let/q xx=x[gx=($fvar)]
let/q yy=y[gy=($fvar)]
let/q xellmap = if xellp then xellpsc+xx + xbar*($vscl)*($duhi) else 0
let/q yellmap = if yellp then yellpsc+yy + ybar*($vscl)*($duhi) else 0

! finally make the plot
set mode ignore_error		! some ellipses may be blank. must ignore_error
can mode verify			! avoid filling window with many messages

vector/set/nolab/($axlim)/len=($vlen) xbar*($vscl),ybar*($vscl)
($axlint_axnmtc)
ppl veckey/nou,0,-.6,,(($veckey_format))
ppl vector,($xskp),($yskp)

label/nou 0 -1. -1 0 .12 ($unitlab)

! identify the vectors that are "significant" (outside the variance ellipse)
! imagine that the ellipse is centered at the vector TAIL for this calculation
! find distance of vector head from all points of the ellipse:
let dist=((xellp-xbar*($vscl))^2 + (yellp-ybar*($vscl))^2)^.5
! find point on the ellipse closest to the vector head,
! compare its distance from the ellipse center with the vector length
let mindist=dist[z=@min]
let zatmin=dist-mindist
let integrandx=xellp*zatmin[k=@weq]
let integrandy=yellp*zatmin[k=@weq]
let xellmin=integrandx[z=@sum]		        ! (x,y)-values of ellipse at
let yellmin=integrandy[z=@sum]		        ! closest point to vector
let distellipse=(xellmin^2 +yellmin^2)^.5	! ellipse radius at closest pt
let distvector=($vscl)*(xbar^2 +ybar^2)^.5	! vector length
let xbarsig=if distvector ge distellipse then xbar    ! extract vectors only
let ybarsig=if distvector ge distellipse then ybar    ! if larger than ellipse

! overplot significant vectors in heavy line
! comment out this line if bolding not wanted
vector/set/nolab/over/len/col=7 xbarsig*($vscl),ybarsig*($vscl)
ppl vector/over,($xskp),($yskp)

! overplot ellipses
! if i1,i2,j1,j2 chosen correctly -> allow ellipses to extend beyond viewport
ppl window,off
repeat/i=($i1):($i2):($xskp) repeat/j=($j1):($j2):($yskp) plot/vs/line=2/over/nolab xellmap,yellmap

! plot titles
label/nou `($ppl$xlen)/2` `($ppl$ylen)+.9` 0 0 .25 Mean and RMS of ($main_title)
label/nou `($ppl$xlen)/2` `($ppl$ylen)+.4` 0 0 .18 ($title_subhead)

! standard ellipse key scaled the same as standard vector
let/q amaj1=($ste1)*($vscl)
let/q bmin1=($ste2)*($vscl)
let/q thetam1=-45*pi/180			! make it tilted
let/q xell1=amaj1*cos(rad)
let/q yell1=bmin1*sin(rad)
let/q xellp1 = xell1*cos(thetam1) + yell1*cos(thetam1-pi/2)
let/q yellp1 = xell1*cos(thetam1+pi/2) + yell1*cos(thetam1)
let/q xellpsc1 = ($duhi) * xellp1
let/q yellpsc1 = ($duhi) * yellp1
let/q xellmap1 = xellpsc1+`($xaxis_min)+(($xaxis_max)-($xaxis_min))/2`
let/q yellmap1 = yellpsc1+`($yaxis_min)-($degpiny)*.8`
ppl window,off
plot/vs/line=2/over/nolab xellmap1,yellmap1

label/nou `($ppl$xlen)/2+.5` -.75 -1 0 .12 Major/minor axes = `($ste1)*($vscl)` and `($ste2)*($vscl)` ($unitlab)
label/nou `($ppl$xlen)/2+.5` -1. -1 0 .12 (Same scale as mean vectors)

ppl window,on
go land thick
[Thread Prev][Thread Next][Index]
Dept of Commerce /
NOAA /
OAR /
PMEL /
TMAP
Contact Us | Privacy Policy | Disclaimer | Accessibility Statement
