|
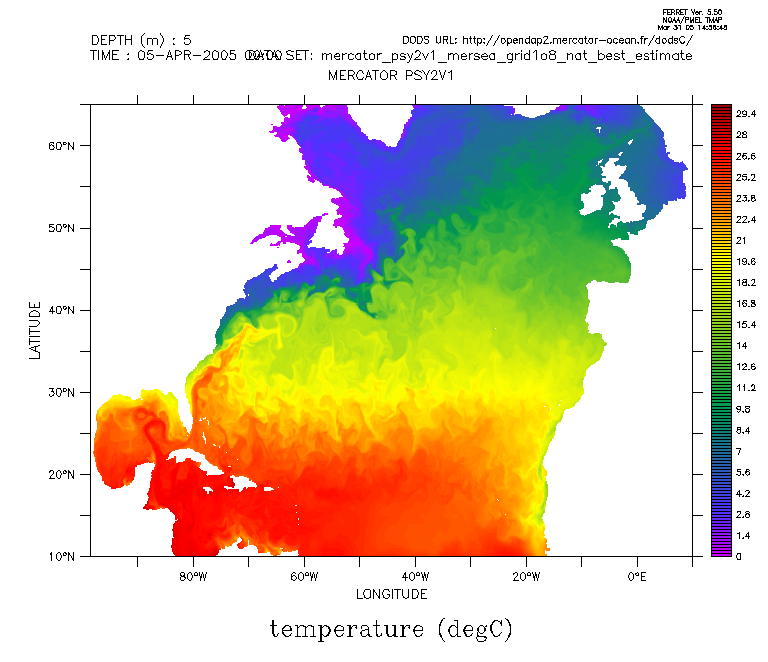
Hi all, I have a dataset which cover a region like this : x=-98:10 y=10N:65N. Is it possible to plot this data in a larger region (x=-100:30 y=10:85) ? Because it seems that automaticaly ferret zoom to the region where data exist. The command below produce the plot attached, but I would like a larger region. [login@las-dev fraser]$ ferret -gif NOAA/PMEL TMAP FERRET v5.50 Linux 2.4.3-12smp - 01/15/03 31-Mar-05 14:56 yes? set data "http://opendap2.mercator-ocean.fr/dodsC/mercator_psy2v1_mersea_grid1o8_nat_best_estimate" yes? show grid temperature GRID GPP1 name axis # pts start end LONGITUDE LONGITUDE 869mr 98.5W(-98.5) 10E LATITUDE LATITUDE 441 r 10N 65N DEPTH DEPTH (m) 12 i- 5 3000 TIME TIME 675 r 01-JUN-2003 00:00 05-APR-2005 00:00 yes? set region/x=-98.5:10/y=0:85N/z=5/t=05-APR-2005 yes? fill/levels=(0,30,0.2) temperature yes? frame/file=temperature.gif yes? exit Tony |