[Thread Prev][Thread Next][Index]
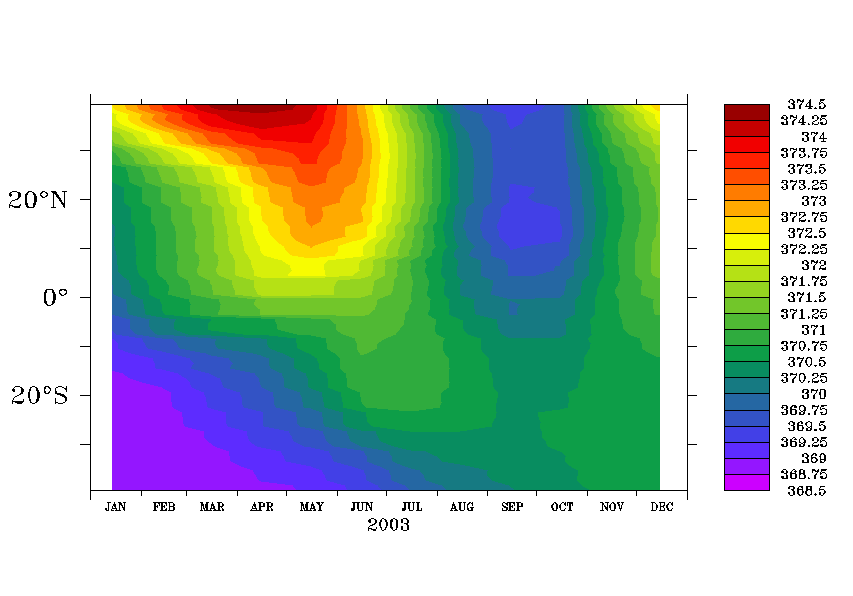
time series plot appearance problem
Hello Ferret Users,
I am making a time series adding the 12 files and
using the following time axis definition :
define axis/t=1:12:1/t0=15-dec-2002/unit=months tax
The time series plot has the white portion before
Jan month and after Dec month. I have to produce
the plot which I can sent for the journal
publication.
Can any one help me that how I can take out this
extra white portion OR can make better this plot.
The plot is attched here.
Thanks,
Regards,
Yogesh
--
===========================================
Yogesh K. Tiwari,
Max-Planck Institute for Biogeochemistry,
Beutenberg Campus, Hans-Knoell-Strasse 10,
D-07745 Jena,
Germany
Office : 0049 3641 576 376
Home : 0049 3641 223 163
Fax : 0049 3641 577 300
Cell : 0049 1520 4591 008
e-mail : yogesh.tiwari@bgc-jena.mpg.de
===========================================

[Thread Prev][Thread Next][Index]
Dept of Commerce /
NOAA /
OAR /
PMEL /
TMAP
Contact Us | Privacy Policy | Disclaimer | Accessibility Statement
