[Thread Prev][Thread Next][Index]
the go land command
Hello,

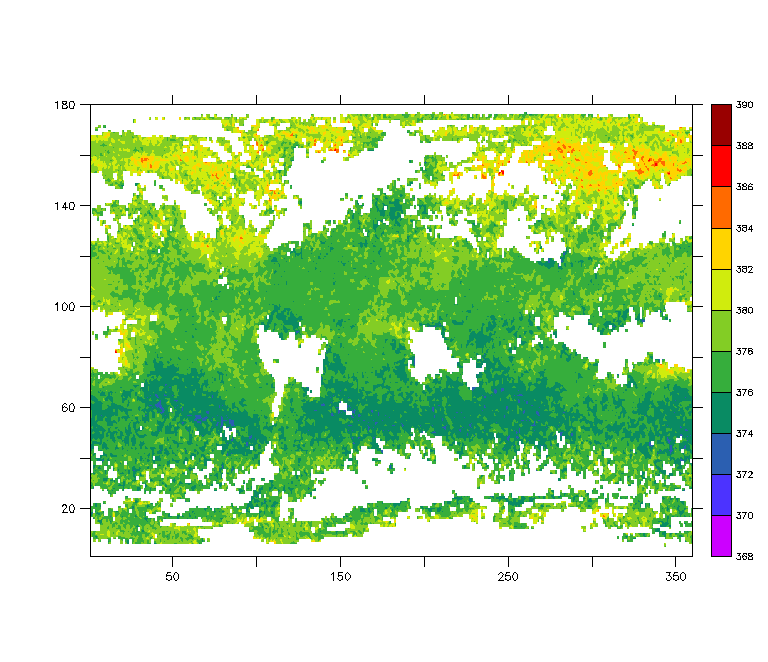
I have the data like :

name     title               I         J         K         L
 LON      Longitude         1:360     ...       ...       ...
 LAT      Latitude          1:180     ...       ...       ...
 CO2_T    Mean co2          1:360     1:180     ...       ...

When I use the command :-

shade/nolab co2_t

it gives the attached plot.

But the plot X and Y-axis values are 0-360 and 0-180, so
the 'go land' command not working.

How to put the 'lon' and 'lat' grid values on co2_t grid,
so the go land command should work.

Many thanks for help.

Regards,
Yogesh

--

===========================================
Yogesh K. Tiwari,
Max-Planck Institute for Biogeochemistry,
Postfach 10 01 64, D-07701 Jena,
Germany

Office   : +49 3641 576376
Fax      : +49 3641 577300
Handy    : +49 1736988789
e-mail   : yogesh.tiwari@bgc-jena.mpg.de
===========================================

[Thread Prev][Thread Next][Index]
Dept of Commerce /
NOAA /
OAR /
PMEL /
TMAP
Contact Us | Privacy Policy | Disclaimer | Accessibility Statement
