This kind of plot is called a "stick plot" in the Ferret documentation.
The plot style looks similar to your figure, but does not have arrow
heads on the vector lines. Here is an example:
yes? use monthly_navy_winds
yes? set region/x=180/y=0
yes? plot/set uwnd,vwnd
yes? ppl plotuv
Here is a message from the Users' List archives which gives
another example and more details about using the VECTOR
command for this kind of plot.
http://ferret.pmel.noaa.gov/Ferret/Mail_Archives/fu_2003/msg00395.html
Ansley Manke
Ganning Zeng wrote:
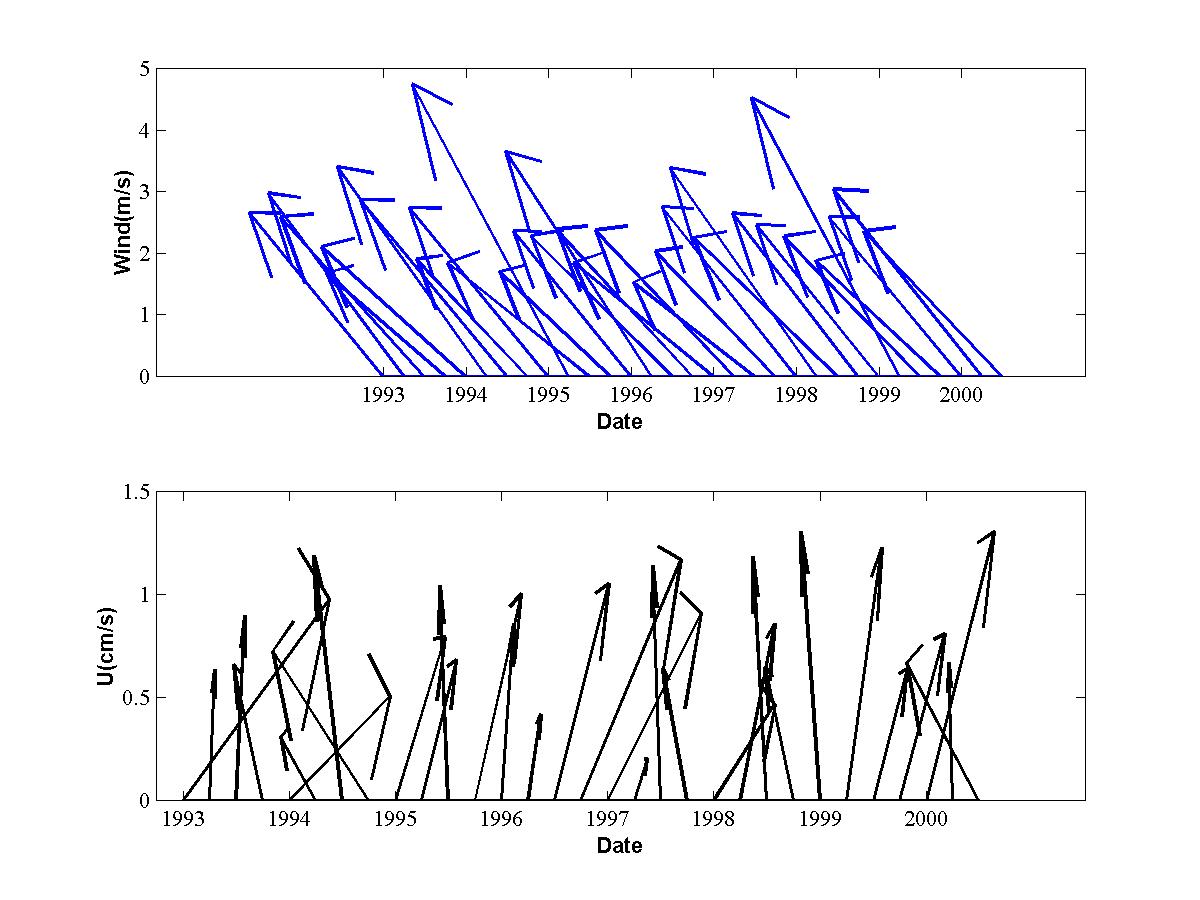
dear ferret users

	How does ferret plot the vector's time series file? like what shows in the following attachment,i.e.horizontal coordinate is time,vertical coordinate is U(U=sqrt(u*u+v*v)).
	thank you very much.

Led_rs@scsio.ac.cn
2003-10-22