[Thread Prev][Thread Next][Index]
vector and shade in curvilinear coordinates
Dear Ferreters,
plotting output of the ORCA2 model (global standard configuration of the
OPA model) I tried to make use of the 3-argument versions of the shade
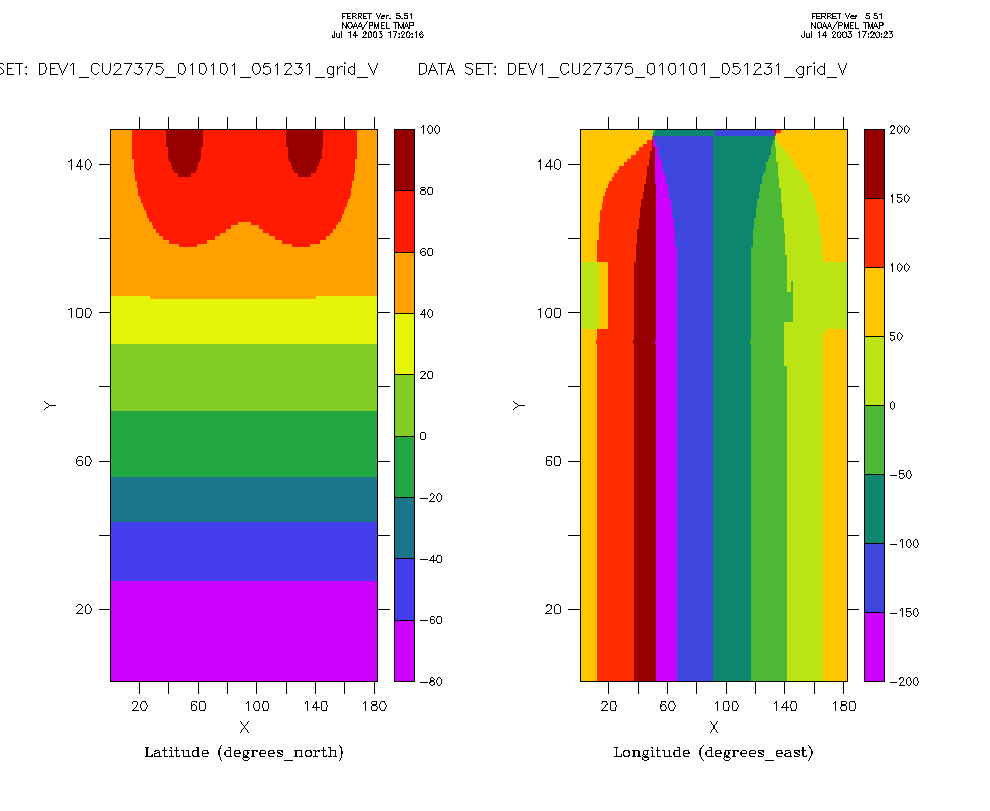
and vector commands. The data are on a tripolar grid, latitude and
longitude are therefore 2D fields (see attached grid.gif).
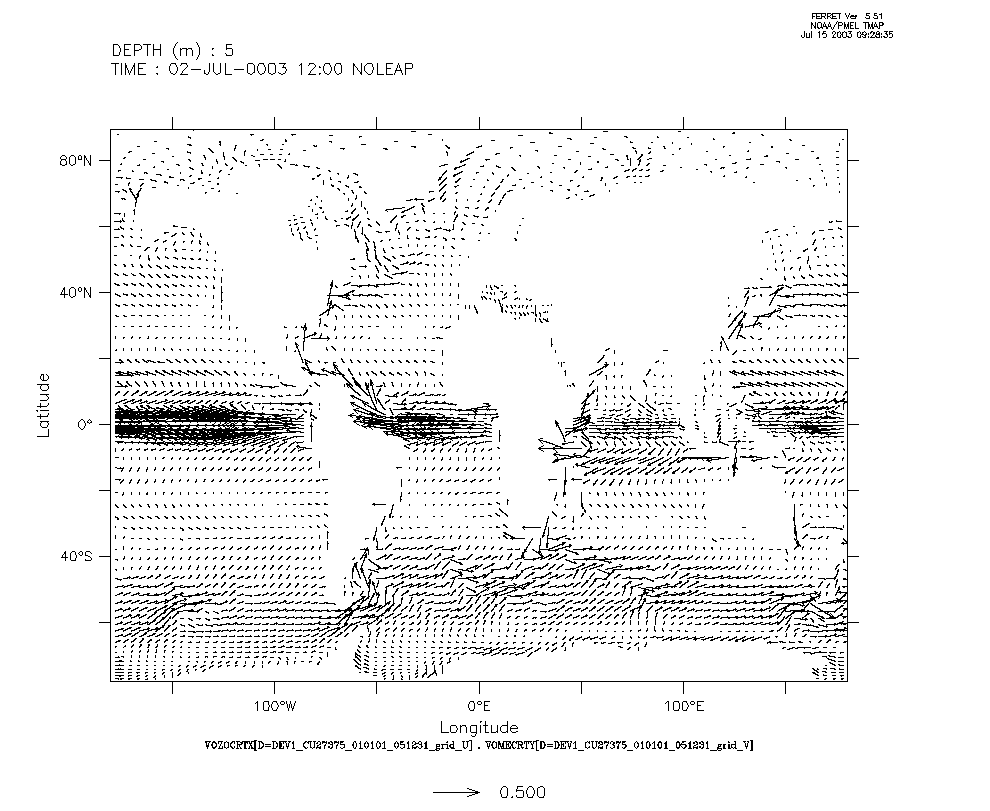
Plotting vectors using
yes? vector u,v,lon,lat
works fine (land masks can easily and correctly be identified, see
vector.gif).
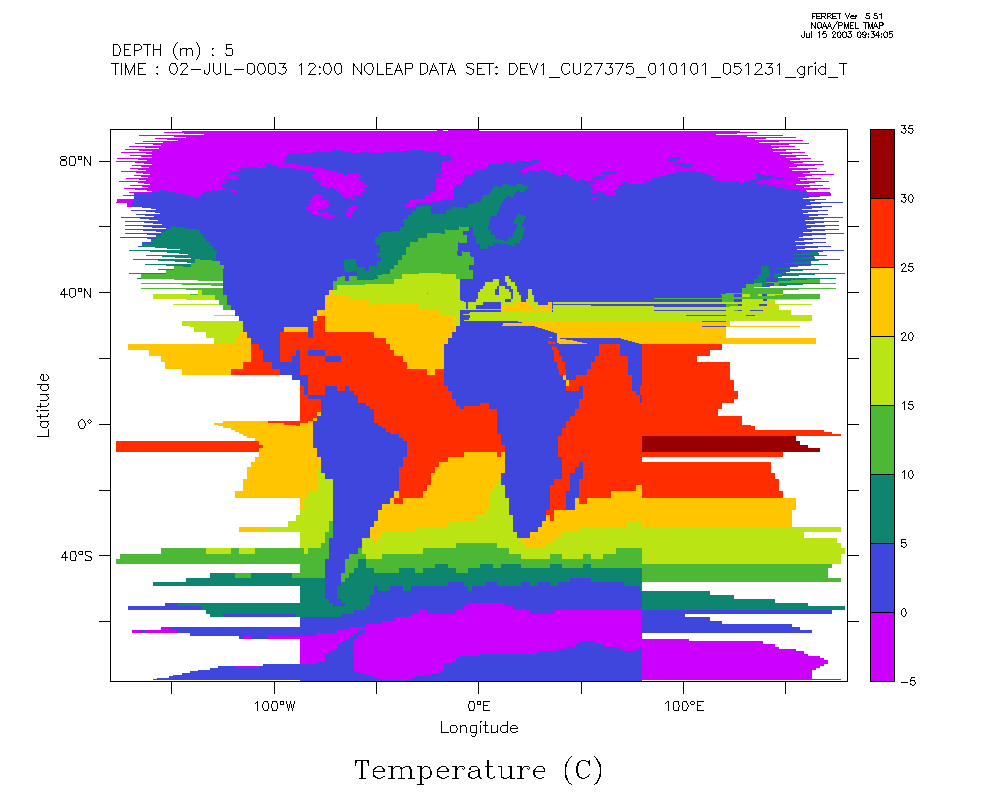
But doing a shade (or fill) using
yes? shade temp,lon,lat
gives distorted fields, only a small central regions seems to be ok (see
shade.gif), outer regions are "fringed". I played around with the axes
(modulo etc.), without any enhancement.
The actual construction of the figures is different for both commands:
vectors are correctly drawn point by point, starting with indices 1,1 of
lat,lon. In contrast the shade command is build up from south to north.
Any ideas from the experts and/or other ORCA/ferret users?
Cheers,
Arne
--
Dr. Arne Biastoch
Institute for Marine Research phone: ++49 431 600-4013
FB1 Ocean Circulation and Climate fax : ++49 431 600-1515
Duesternbrooker Weg 20 email: abiastoch@ifm.uni-kiel.de
24105 Kiel, Germany
http://www.ifm.uni-kiel.de/fb/fb1/tm/data/pers/abiastoch.html


[Thread Prev][Thread Next][Index]
Dept of Commerce /
NOAA /
OAR /
PMEL /
TMAP
Contact Us | Privacy Policy | Disclaimer | Accessibility Statement
