[Thread Prev][Thread Next][Index]
vector and stereographic map
Hi,
I would like to plot vectors from the NSIDC lat, lon grid (an irregular
grid) with a stereograhic map projection.
My dataset contains :
latitude(i, j), longitude(i, j), zonal_motion(i, j),
meridional_motion(i, j))
I use :
set region/x=0:360/y=45:90
go mp_stereographic_north -45 50
use $1
let mp_lambda = longitude*deg2rad
let mp_phi = latitude*deg2rad
set grid zonal_motion
can region
vector/over/len=1000/color=black zonal_motion, meridional_motion,
x_page, y_page
let mp_lambda = mp_x * deg2rad
let mp_phi = mp_y * deg2rad
set region/x=0:360/y=45:90
go mp_fland 20
go mp_graticule 0 360 10 45 90 10
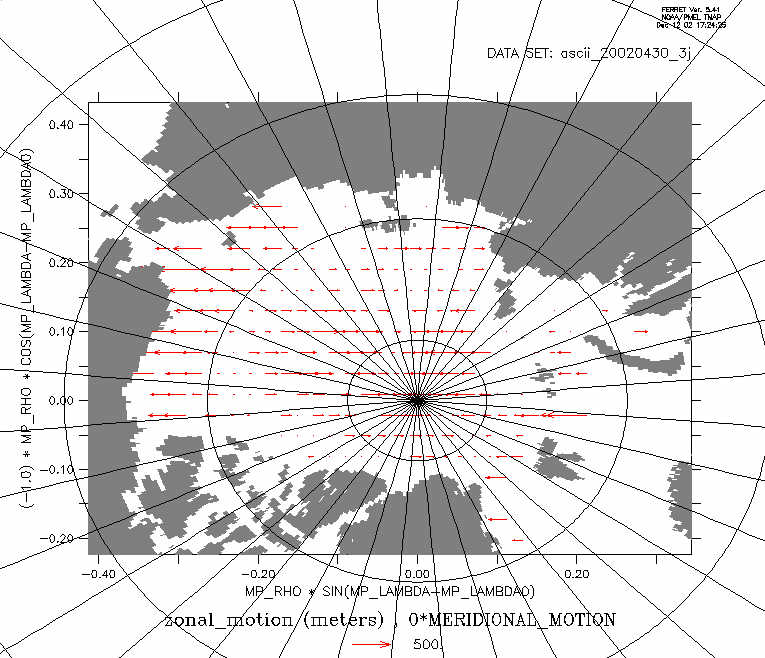
The origin and module of vectors are correctly plotted but the direction
of vector is wrong.
If I set the "meriodional_motion" or the "zonal_motion" to 0, I can see
that the zonal or the meridional componant are plot along the X or the Y
direction of the screen window instead of following the real zonal or
meridional axis (shown by the graticule).
I attached one snap shot with a 0-meridional componant.
What can I do to display the correct vector direction ?
Thanks,
Bye,
Thomas.
[Thread Prev][Thread Next][Index]
Dept of Commerce /
NOAA /
OAR /
PMEL /
TMAP
Contact Us | Privacy Policy | Disclaimer | Accessibility Statement