[Thread Prev][Thread Next][Index]
Re: Creating axes from Data
Richard,
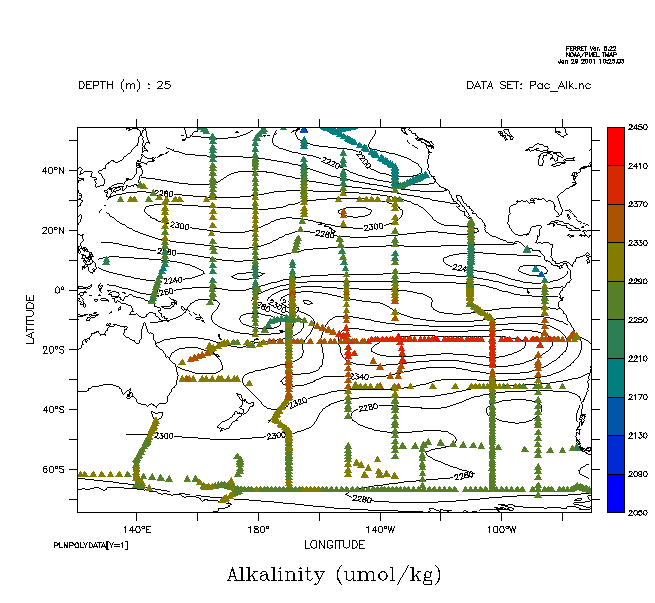
Here is a Ferret session I used to plot some data collected at various
stations in the Pacific ocean. I've attached the output plot so you can
see what it looks like. Your data should can be viewed in a similar
manner. The ALK variable is a gridded representation of the same data
available in STATION_VAL. The different K levels represent different
depths at which data was collected while I denotes individual stations.
use Pac_Alk.nc
show data
currently SET data sets:
1> ./Pac_Alk.nc (default)
name title I J
K L
STATION_LON
Longitude 1:25000 1:1 1:53
...
STATION_LAT
Latitude 1:25000 1:1 1:53
...
STATION_VAL
Alkalinity 1:25000 1:1 1:53
...
ALK Alkalinity 1:170 1:130 1:53
...
set win/size=.4
contour alk[k=1]
go land
can region/x/y
go polymark POLY/OVER/KEY/lev=(2050,2450,40)/pal=in_situ_rainbow
station_lon[k=1] station_lat[k=1] station_val[k=1] triangle .3
Hope that helps,
-- Jonathan Callahan
Richard Dixon wrote:
>
> Dear Ferret-Users
>
> I am currently using a meteorological netcdf file that has got several
> lists of data for synoptic stations around the world: each array is just
> one dimensional and contains data such as temperature, rainfall, etc. and
> also two arrays of latitude and longitude.
>
> Does anyone know how it might be possible to do an x-y plot of
> temperature etc. on a lat/long grid using the latitude longitude points in
> the file.
>
> Best regards
> Richard
[Thread Prev][Thread Next][Index]
Dept of Commerce /
NOAA /
OAR /
PMEL /
TMAP
Contact Us | Privacy Policy | Disclaimer | Accessibility Statement