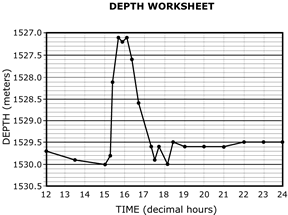
Then the lava flow stopped spreading outward and began to thicken or inflate upward with a solid crust over a molten interior. During this inflation stage, the rumbleometer was actually lifted upward three meters by the solid upper crust. Soon, thereafter, the eruption began to wane and lava drained back into the eruptive vent, and the rumbleometer was lowered back down, ending up about half a meter higher than it started. Perhaps most remarkably, all this took place in the span of only two hours. This is the first time that a submarine eruption has actually been caught in the act, all because an instrument was in the right place at the right time, and managed to survive! This data explains why the instrument was not buried by lava.
During Classroom Activity #4 would be a great time to play Movie #5 from Part 3 of the NeMO Curriculum. This movie shows the sequence of events described above. (Note: you will need the Quicktime Plug-in for your web browser).