Contour-profile
instructions - page 3
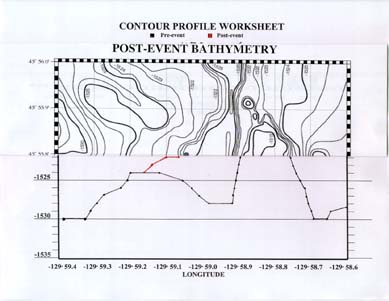
Connect
the red dots with the red pencil and you will see a POST-event cross-section
along the same line of latitude.
Version
2.0 


 page
45 of 55
page
45 of 55
|
Contour-profile
instructions - page 3
|
|
| Connect the dots on the worksheet as you work your way completely across the fold line on the map. You are making a PRE-event cross-section of the ocean floor depth along the 45° 55.8' latitude line. | |
|
Repeat the procedure with the same worksheet, but use the POST-event bathymetric map, also folded along the 45° 55.8' latitude line. Where the depth is the same, do not make a mark, since one is already there. However, when the contour line is at a different location, make a dot with the red pencil on the worksheet. |
|
Connect
the red dots with the red pencil and you will see a POST-event cross-section
along the same line of latitude.
|
|
|
Version
2.0
|
|