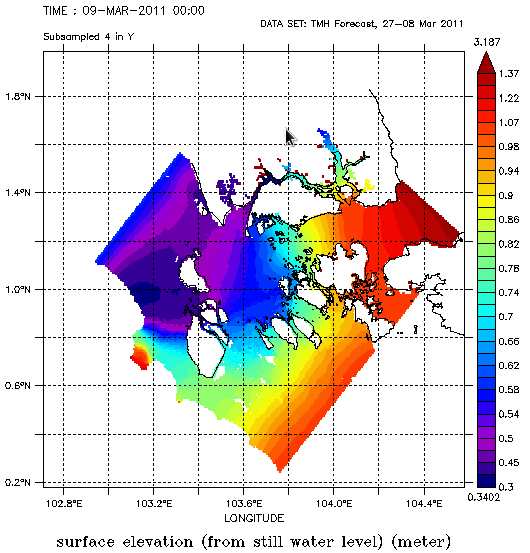
We were able to apply our custom coastline to our datasets by modifying the 'go land_detail' in the xy_2D_plot.jnl to our own custom script 'go land_coastdetail'. We can noticeably see the outline of the land masses as seen below:
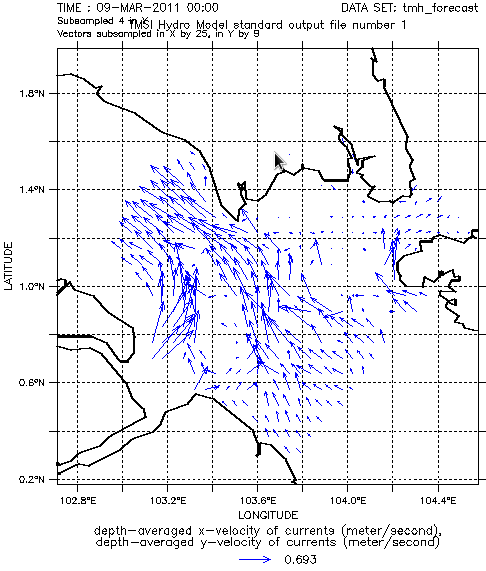
However, when we do vector plots, the coastline detail disappears. As seen below:
Is there a solution for this? Is it also possible to overlay the vector arrows in map plots such as with the first image above? Your help is greatly appreciated.