On Fri, 1 Sept 2023 at 09:21, Ryo Furue <furue@xxxxxxxxxx> wrote:
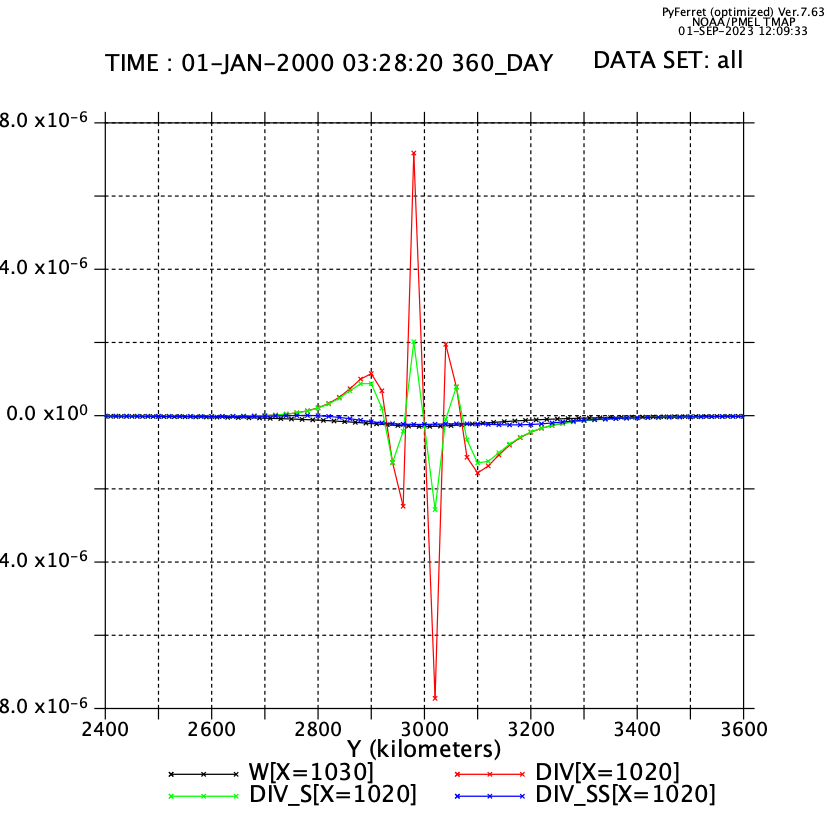
Dear Satheesh and Ferret users,I have "soda_3.15.2_mn_ocean_reg_*.nc" data obtained from https://www2.atmos.umd.edu/~ocean/index_files/soda3.15.2_mn_download_b.htmIt has T,S,U,V, dia-surface velocity T-points, SSH, etc.Please advise how I can estimate vertical velocity using the available information.A short answer is, vertically integrate the continuity equation w_z = - u_x - v_y, where the horizontal derivatives are calculated with Ferret's differentiation operators.But, I have no idea how robust the result will be. Vertical velocity is a noisy quantity and an ad-hoc method like this may give you an unreliable answer.Since that message of mine, I have experienced exactly this problem. The bottom line is, use the model's continuity equation!Below is a plot of vertical velocity from a numerical linear shallow-water equation: w = -H * (∂u/∂x + ∂v/∂y). The black curve is the true w, calculated using the model's (discrete) continuity equation. The horizontal velocity field (u,v) is very smooth and well resolved by the grid, and as a result, the black curve is very smooth and well resolved. In contrast, the red curve is w calculated with Ferret's centered difference operator @DDC. I'm pasting the Ferret code below the image. Although the central, large-amplitude wiggles are suspicious with only one gridpoint per peak, the outer lobe looks well resolved. So, if you look at the red curve without knowing the true vertical velocity, you might think this may be a real physical phenomenon, perhaps a gravity wave!Am I not using the @DDC operator correctly? I don't think that's the case. If you heavily smooth the red curve, it approaches the true vertical velocity, as the blue curve shows. (This numerical code uses the B-grid and the Cartesian coordinates. So, u[x=@DDC] + v[y=@DDC] is the right calculation.)Vertical velocity is proportional to the difference between ∂u/∂x and −∂v/∂y. If you plot them, they look almost identical. That is, for a large-scale flow, the horizontal velocity field is almost divergenceless: ∂u/∂x + ∂v/∂y ≈ 0. That means that w is the residual. It's a big number minus a big number. So, a little minor difference in horizontal derivative results in a significant difference in w. (This is not the classical truncation error of single-precision floats. As the blue curve shows, even this big-number-minus-big-number calculation is giving the "correct" numbers.)Now, if you look at typical GCM results, you find that the horizontal field isn't always as well-resolved as in my ideal model. You often find the horizontal field marginally resolved. Our experience is that that's fine: even a marginally resolved field isn't very far from the reality. So, the vertical velocity field, if calculated correctly, should also be physically sound. The problem here is that you have to calculate it correctly.Ryoset data all.nc
let div = (-1)*(u[x=@DDC] + v[y=@DDC])*4000 ! depth * div(u,v)
let div_s = div[i=@SHN:3,j=@SHN:3] ! a bit smoothed
let div_ss = div[i=@SHN:17,j=@SHN:17] ! heavily smoothed
plot/line/symbol/x=1030/L=1/hlimits=2400:3600 w, div, div_s, div_ss
frame/file=tmp.pngTo get a robust result,1. First, examine the SODA manual to find out what grid configuration SODA uses. For example, let's assume that it uses the C grid.2. Use the C-grid continuity equation to calculate vertical velocity, which should be identical to the vertical velocity within SODA. (SODA must have vertical velocity internally. Whether it saves/outputs it or not is a separate issue.)I don't think you can do this within Ferret.Ryo