I happened to look at our standard dynamic height script today.
(On my system it is .../opt/miniconda3/pkgs/pyferret-7.6.3-py37hfb0c5.1/go/dynamic_height.jnl)
(comments say "updated in 10/93" ... before some of you were even born ...)
(the script is also attached FYI)
I think there's a subtle error in this script, due to the upward indefinite integral.
Beyond dynamic height, the issue occurs anytime where @iin (or @rsum) is used.
The relevant parts of the dynamic_height.jnl algorithm are:
! Standard _expression_ for specific volume anomaly
let SVanom = 1/rho_UN(dyn_s,dyn_t,dyn_p) - 1/rho_UN(35,0,dyn_p) ! dyn_[s,t,p] are temp,salinity,pressure
! The _expression_ for the top-to-bottom integral is straightforward:
let/title="Dynamic Height(dyn-cm)" DYN_HT = 1E5 * dyn_mask * SVanom[z=@din] ! (dyn_mask excludes incomplete profiles)
! But for a z-dependent result, the direction of the z-axis and of integration must be considered.
! The z-axis is typically DOWNWARD (/DEPTH in the axis definition), but the intended integration is UPWARD.
! Thus the indefinite integral @iin needs to be reversed using @din minus @iin.
! In the script this is:
let/title="Dynamic Height(dyn-cm)" DYN_HTz = 1E5 * dyn_mask * (SVanom[z=@din]-SVanom[z=@iin])
! However, the user probably expects the value to be at the same depths as the density data, namely at the center of each grid cell.
! But the script's _expression_ integrates completely through each grid cell, giving the value of the integral at the TOP of the cell.
! - - - - - - - - -
! A simple way to see what's happening is with a simple example of the results of @din - @iin, defining an example that can be followed in your head:
define axis/z/depth zdep={1,2,3,4,5} ! simple downward z-axis
let zvals = 2*z[gz=zdep] ! variable on this axis with values twice the axis value
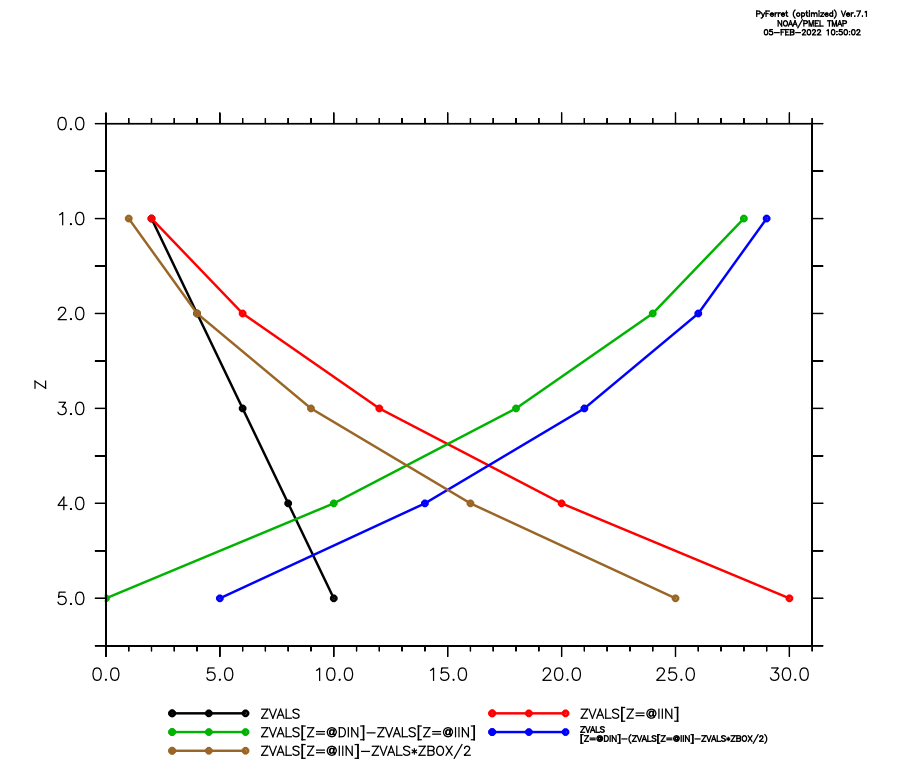
! plot ZVALS, its downward integral and two versions of its upward integral (attached png file)
! (also include a downward @iin integration: red and brown lines)
plot/line/sym=27/thick=2/vli=0:5.5/hli=0:31:5 zvals,zvals[z=@iin],zvals[z=@din]-zvals[z=@iin],zvals[z=@din]-(zvals[z=@iin]-zvals*zbox/2),zvals[z=@iin]-zvals*zbox/2! list the relevant pieces, including the grid cell size and limits:
list z[gz=zdep],zbox[gz=zdep],zboxlo[gz=zdep],zboxhi[gz=zdep],zvals,zvals[z=@iin],zvals[z=@din]-zvals[z=@iin],zvals[z=@din]-(zvals[z=@iin]-zvals*zbox/2),zvals[z=@iin]-zvals*zbox/2Z: 0.5 to 5.5
Column 1: Z is Z (axis ZDEP)
Column 2: ZBOX is ZBOX (axis ZDEP)
Column 3: ZBOXLO is ZBOXLO (axis ZDEP)
Column 4: ZBOXHI is ZBOXHI (axis ZDEP)
Column 5: ZVALS is 2*Z[GZ=ZDEP]
Column 6: ZVALS[Z=@IIN] is 2*Z[GZ=ZDEP] (indef. integ. on Z) ! simple downward @iin
Column 7: EX#7 is ZVALS[Z=@DIN]-ZVALS[Z=@IIN] ! integration as in dynamic_height.jnl
Column 8: EX#8 is ZVALS[Z=@DIN]-(ZVALS[Z=@IIN]-ZVALS*ZBOX/2) ! I think this is correct for DH
Column 9: EX#9 is ZVALS[Z=@IIN]-ZVALS*ZBOX/2 ! correct downward integration
Z ZBOX ZBOXLO ZBOXHI ZVALS ZVALS EX#7 EX#8 EX#9
1 / 1: 1.000 1.000 0.500 1.500 2.00 2.00 28.00 29.00 1.00
2 / 2: 2.000 1.000 1.500 2.500 4.00 6.00 24.00 26.00 4.00
3 / 3: 3.000 1.000 2.500 3.500 6.00 12.00 18.00 21.00 9.00
4 / 4: 4.000 1.000 3.500 4.500 8.00 20.00 10.00 14.00 16.00
5 / 5: 5.000 1.000 4.500 5.500 10.00 30.00 0.00 5.00 25.00
We're comparing EX#7 (as in dynamic_height.jnl, green line on plot) and EX#8 (I think is correct, blue line).
Which is correct?
The issue is that the value of the integral is understood as being at the grid cell centers.
Starting at a value of 30 at the bottom of the deepest cell (z=5.5), the first value is halfway up that cell, thus half of ZVALS[z=5], namely 5. An _expression_ like in dynamic_height.jnl gives 0.
Following the blue line, the value of the integral at the highest gridcell (z=1) is 29 (not 30 because this integration is not to the top of the cell at z=0.5). Nor is is 28, which is what an integration like in dynamic_height.jnl would give.
! - - - - - - - - -
Thus I think the correct _expression_ for the dynamic height integration should be like EX#8:
let/title="Dynamic Height(dyn-cm)" DYN_HTz = 1E5 * dyn_mask * (SVanom[z=@din]-(SVanom[z=@iin]-SVanom*ZBOX/2))
The same issue occurs in any @iin integration.
Consider the red line in the attached plot (ZVALS[z=@iin], EX#9 in the listing above).
At the first grid cell (z=1) the value is 2, the whole value of ZVALS[k=1], as if the integration had been carried through the whole cell (thus to z=1.5).
A corrected version is the brown line: zvals[z=@iin]-zvals*zbox/2, namely to the center of each cell.
=> Bottom line is that the results of @iin and @rsum need to be considered with care.
Where exactly do you expect the result to apply?
Billy K