Dear all,
I've been trying to plot the grid from my model on top of a shade plot and I just cant seem to make it right. I have two grids, one regular and another irregular and curved along the coast.
Here is how I'm plotting that for the regular grid.
let lon_hyc2 = (lon_hyc+lon_hyc[i=@shf:1])/2
let lat_hyc2 = (lat_hyc+lat_hyc[j=@shf:1])/2
shade h,lon_hyc2,lat_hyc2
plot/dash/vs/ov lon_hyc2,lat_hyc2
I don't know if that is a coincidence, but the plot works fine for the area I'm plotting as can be seem bellow.
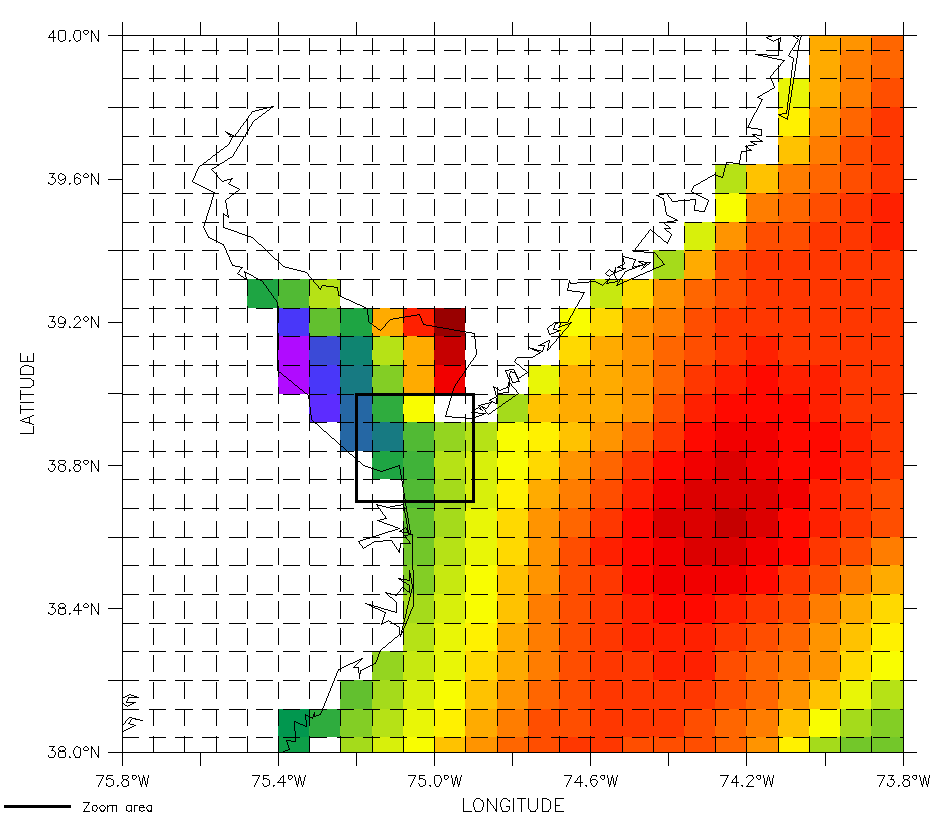
However, when I try to do the same to the irregular grid, this is what I get.
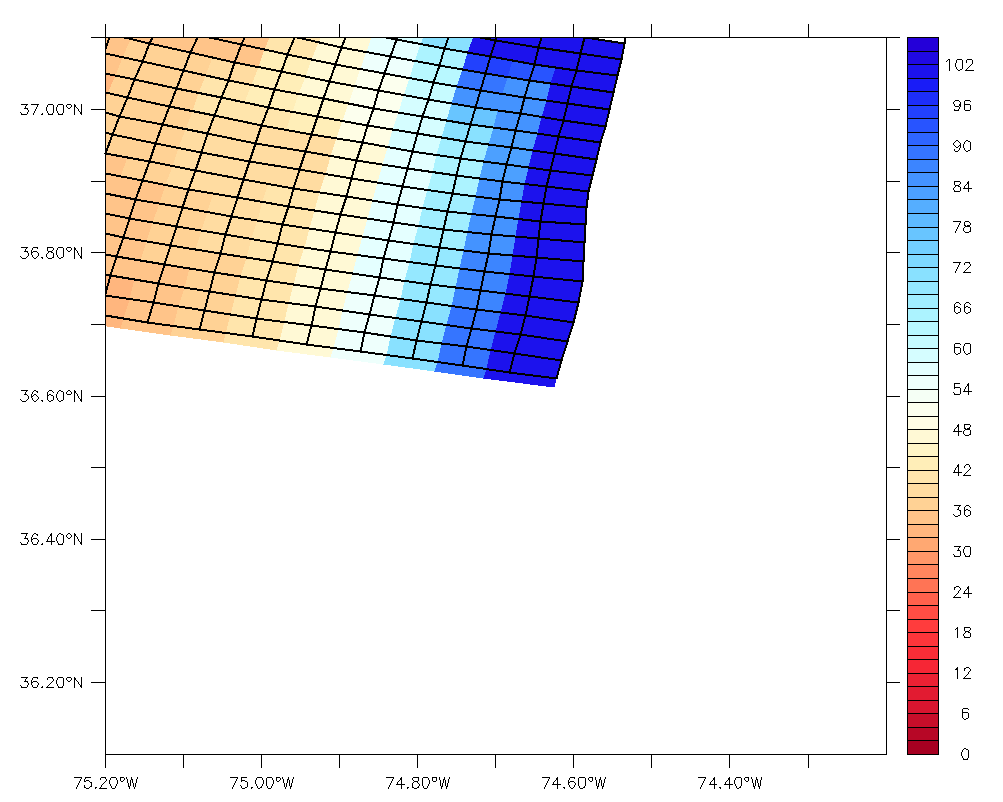
Both models are not projected, with lon and lat in their respective variables.
Is there an easier way to do that?
Thanks in advance,
Thanks in advance,
Andre Rodrigues