Hi,
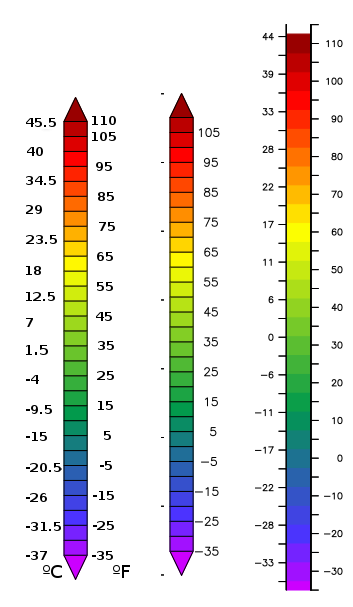
Sorry if I missed something obvious, but I haven't been able to search up a solution. The color bar on the left is what I'm trying to accomplish. I hacked it up in an image editing program. The middle color bar is what gets created auto-magically when making a shade plot with levels=(-inf)(-35, 110, 5)(inf) and the one on the right is my so far unsuccessful attempts to make such a scale using the ccbar.jnl script in the distribution. To get it, I run the guts of ccbar twice just changing the min, max and delta and the side upon which the ticks are written. I don't get quite the range I expect using -35 110 5 in ccbar.jnl and I haven't figured out a technique to draw the nice triangles on the top and bottom. Thanks in advance for any suggestions.
Roland