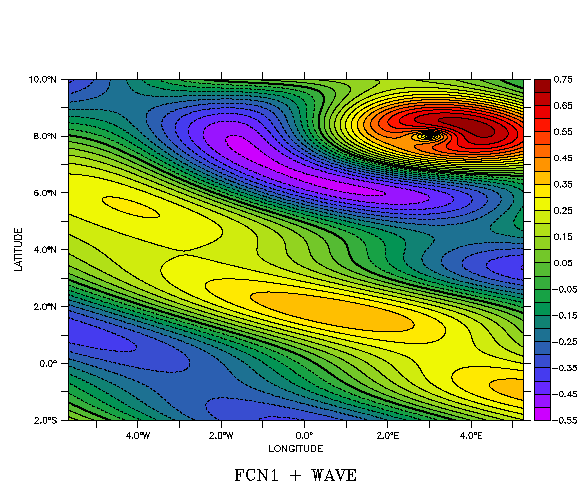
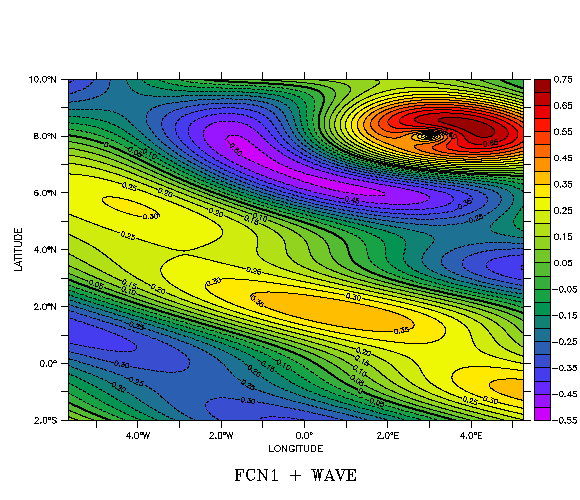
I think we have a resolution of the question Szymon was asking here.
In the last version of Ferret we did some work to improve the labeling of contours on fine grids. I think if you upgrade to Ferret v6.7, the latest release, you'll find that your contours are labeled.
I created a function on your fine grid, xfine,yfine. I'll include the script below.
Plotted with Ferret v667,

and plotted with Ferret v67:

Here is the script: The command FILL/LINE/KEY is equivalent to FILL and then CONTOUR/OVER/NOLABEL.
! Define a function to contour
let WAVE = SIN(KX*XPTS + KY*YPTS - PHASE) / 3
let PHASE = 0
let KAPPA = 0.4
let KX = 0.4
let KY = 0.7
let FCN1 = SIN(R)/(R+1)
let R = ((XPTS-X0)^2+ 5*(YPTS-Y0)^2)^0.5
let X0 = 3
let Y0 = 8
LET sample_function = fcn1 + wave
let xpts = x; let ypts = y
! Define coarser grid and plot the function
!1. swh_coarse value
DEFINE AXIS/X=-5.666666667:5.25:0.083333333/unit=degree xlon
DEFINE AXIS/Y=-2.0:10.0:0.083333333/unit=degree ylat
DEFINE GRID/x=xlon/y=ylat grid_xlon_ylat
set grid grid_xlon_ylat
shade sample_function
fill/line/key sample_function
! Define fine grid and regrid to it.
!2. swh_smooth value
DEFINE AXIS/X=-5.666666667:5.25:0.010416667/unit=degree xfine
DEFINE AXIS/Y=-2.0:10.0:0.010416667/unit=degree yfine !1/8
DEFINE GRID/x=xfine/y=yfine grid_xfine_yfine
fill/line/key sample_function[gxy=grid_xfine_yfine]; pause
On 7/15/2011 5:03 AM, Szymon Roziewski wrote:
Hello Ansley,

thank you very much for your engagement. I very appreciate it.
In fact, the solutions with size=0.8/spacing=1 or even
size=0.2/spacing=0.001 or so on seem not to work.
I tried to work around the issue by smoothing.
What I did is as follows:
I shaded swh_smooth value and before making contours I smoothed the
value without regridding.
So, I have swh_smooth on a fine grid and swh_coarse on a coarse grid.
Doing in that way come up with following result (I attach a picture).
Now I have labels at contours.
But it's not a case. Because the contours are not well-fitting the
shaded values.
I'd rather have labels at well-fitting contours (straight by making
contours from swh_smooth value) but how I can get this effect?

My variables are on grids
1. swh_coarse value
DEFINE AXIS/X=-5.666666667:5.25:0.083333333/unit=degree xlon
DEFINE AXIS/Y=-2.0:10.0:0.083333333/unit=degree ylat
DEFINE GRID/x=xlon/y=ylat grid_xlon_ylat
2. swh_smooth value
DEFINE AXIS/X=-5.666666667:5.25:0.010416667/unit=degree xfine
DEFINE AXIS/Y=-2.0:10.0:0.010416667/unit=degree yfine !1/8
DEFINE GRID/x=xfine/y=yfine grid_xfine_yfine

Best wishes,
Szymon Roziewski