[Thread Prev][Thread Next][Index]
[ferret_users] Multi-variables plot not working?
- To: ferret_users@xxxxxxxx
- Subject: [ferret_users] Multi-variables plot not working?
- From: "Yu, Hao-Cheng" <danish.url@xxxxxxxxx>
- Date: Tue, 28 Aug 2007 16:39:16 +0800
- Dkim-signature: a=rsa-sha1; c=relaxed/relaxed; d=gmail.com; s=beta; h=domainkey-signature:received:received:message-id:date:from:to:subject:mime-version:content-type; b=VEziUYeQ5TBwgE7/LQon8cKS2uJXgE++N6SyJJM4SVbdGBM7FxK8OCj0xSEnHb/Gv5ow4dYHdyTtkoha9PBpwTPgJTOMw+DLEWR42kOv4ZJLV0buz6pMoB9yz2fuLazWmz7D0s8ghQS8HsK1UtuVNbH4SAW8ccr90/bUO22OHEo=
- Domainkey-signature: a=rsa-sha1; c=nofws; d=gmail.com; s=beta; h=received:message-id:date:from:to:subject:mime-version:content-type; b=ed7SeegIBsz5+4MSOda2pwPAh/UAlR/lpHFZoy1tNHpb85LPff3OpJAo5GyB62ZCNYVzst1JUUUrFXlrz4A6R4MM19RrN8e2/McQOoZV+jcBQFKnpwX/iuIcx/TDcdPOFqdYLHNtkO9e/0FwSOus2IEho2iP5ebkxdi3KJte/04=
- Sender: owner-ferret_users@xxxxxxxx
Dear ferreters,
I try to plot a time series with different data and follow the demo to build my own scripts.
The demo works fine!
But my scripts won't plot specify stick except the first one!
Is there any wrong with my scripts or ferret?
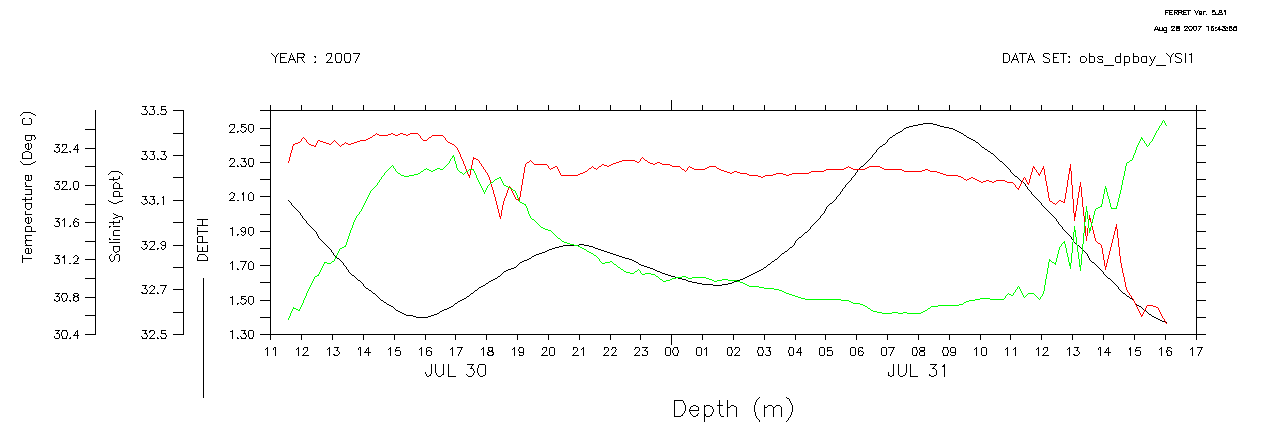
GO multi_yaxis_plot1 depth 2 "Depth (m)"
GO multi_yaxis_overlay salt 1 "-" " " "Salinity (ppt)"
GO multi_yaxis_overlay temp 2 "-" " " "Temperature (Deg C)"
Then produce plot like attach.
Any ideas?
dan
Attachment:
test.gif
Description: GIF image
[Thread Prev][Thread Next][Index]
Contact Us
Dept of Commerce /
NOAA /
OAR /
PMEL /
TMAP
Privacy Policy | Disclaimer | Accessibility Statement