Dear Jaison,
Thanks for your response, it is solved now.
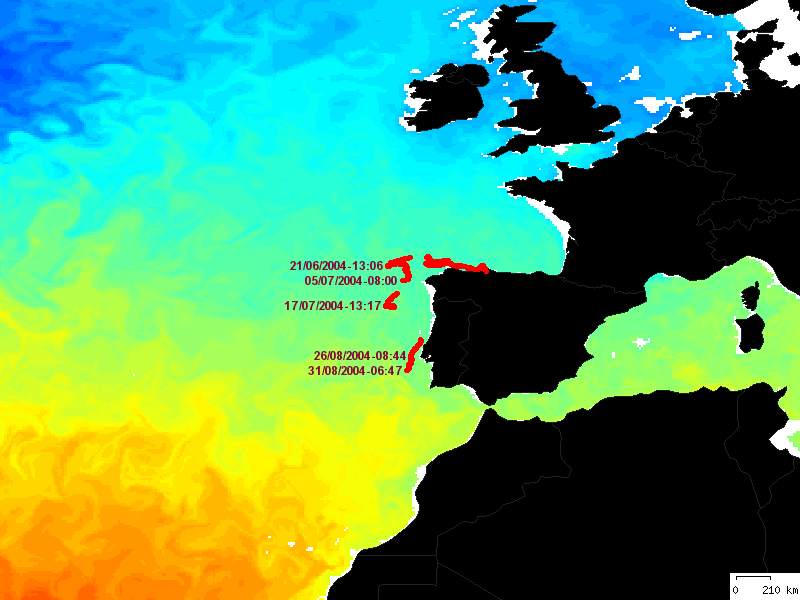
Then another question : is it possible to overlay buoy location with an
oceanographic field, like temperature for example, without any
interpolation to put the scattered
data onto a grid (see image attached) ?
Best regards,
Tony
PS : Jaison, my error was : first there was 2 buoys in my file, so the
time was not, momotonic, and second I didn't know the "set pecision" so
I searched on a wrong way to solve my problem. Thanks a lot.
Jaison Kurian wrote:
Hi Tony & Ansley,
                    I think Ferret is right in this case. For the given
subset of your data Ferret makes a time axis within the error of 1
seconds.

Few corrections to your script :
        LET days_2001 = DAYS1900(2002,1,1)  ==> T0 should be 1-jan-2002
                                          ( not 1-jan-2001)
       If FILE command doesn't have the /grid=gridname qualifier it will
         read the variable on to X-axis/grid (try listing tstep). So
         "tstep[L=1:50]" is meaningless ; "tstep" is good enough.

test.dat
--------
[5] 2002-07-28 13:59:50 09435 28700 NM T 2 48.989 339.229
[5] 2002-07-28 14:37:53 09435 28700 NH T 2 48.987 339.230
[5] 2002-07-28 15:13:44 09435 28700 NL T 3 48.989 339.245
[5] 2002-07-28 16:05:40 09435 28700 ND T 1 48.988 339.252
[5] 2002-07-28 16:56:52 09435 28700 NL T 1 48.989 339.269
[5] 2002-07-28 17:40:02 09435 28700 NJ T 3 48.996 339.281
[5] 2002-07-28 19:18:48 09435 28700 NJ T 2 48.995 339.318
[5] 2002-07-28 19:29:02 09435 28700 NK T 1 48.999 339.343


test.jnl
--------
   FILE/SKIP=0/FORMAT=delim/delimiter="\b"/type="text,date,time"  test.dat
   LET days_2001 = DAYS1900(2002,1,1)
   LET day_frac  = v3/24
   LET tstep     = v2 - days_2001 + day_frac
   DEFINE axis/T/T0=1-jan-2002/UNIT=days ttaxis=tstep
   set list/precision=7  ! <== to see up to 4 deci. places
   list t[gt=ttaxis]
   ..................
                VARIABLE : T
                           axis TTAXIS
                SUBSET   : 8 points (TIME)
    28-JUL-2002 13:59:50 / 1:  208.5832
    28-JUL-2002 14:37:52 / 2:  208.6096
    28-JUL-2002 15:13:43 / 3:  208.6345
    28-JUL-2002 16:05:40 / 4:  208.6706
    28-JUL-2002 16:56:52 / 5:  208.7062
    28-JUL-2002 17:40:01 / 6:  208.7361
    28-JUL-2002 19:18:47 / 7:  208.8047
    28-JUL-2002 19:29:01 / 8:  208.8118

 Please note that the error is of the order of 1 second only. For this
subset of your actual data, Ferret is doing a good job. Please check the
remaining portion of your data for decreasing values (say from 9th line
to 50th line). There will be at least one line of data with values for
hr/min/sec less than the previous line with respect to the date. Try to
see the values of tstep after increasing the list precision.

Hope this helps

With Regards

Jaison

On Wed, 27 Oct 2004, Tony Jolibois wrote:
                Hi Ansley,

Excuse me I didn't send details. Here it is :
The data contains year, month, day, hour-minute-second, location and
other things :
buoy.dat :
[5] 2002-07-28 13:59:50 09435 28700 NM  T  2   48.989  339.229
[5] 2002-07-28 14:37:53 09435 28700 NH  T  2   48.987  339.230
[5] 2002-07-28 15:13:44 09435 28700 NL  T  3   48.989  339.245
[5] 2002-07-28 16:05:40 09435 28700 ND  T  1   48.988  339.252
[5] 2002-07-28 16:56:52 09435 28700 NL  T  1   48.989  339.269
[5] 2002-07-28 17:40:02 09435 28700 NJ  T  3   48.996  339.281
[5] 2002-07-28 19:18:48 09435 28700 NJ  T  2   48.995  339.318
[5] 2002-07-28 19:29:02 09435 28700 NK  T  1   48.999  339.343
       --------- time ----------
    lat            lon

Here is the script I tried to create the time axis :

FILE/FORMAT=delim/delimiter="\b,\t"/type="text,date,time,numeric,numeric,text,text,numeric,latitude,longitude"/EZ
bouee_28700-32790.txt
LET days_2001 = DAYS1900(2002,1,1)
LET day_frac = v3/24
LET tstep = v2 - days_2001 + day_frac
list tstep
 1      /    1:  175.7
 2      /    2:  175.7
 3      /    3:  175.7
 4      /    4:  175.7
 5      /    5:  175.8
 6      /    6:  175.8
 7      /    7:  175.9
 8      /    8:  175.9
...
So you can see that when I try to create the time axis, ferret says

DEFINE axis/T/T0=1-jan-2001/UNIT=days ttaxis=tstep[L=1:50]
 **ERROR: improper grid or axis definition: data for DEFINE
AXIS/FROM_VARIABLE is not monotonic

Thanks for your response,
Tony

2002-07-28 13:59:50

Ansley Manke wrote:
Hi Tony,
What are your timestps like?  Units of seconds over the course
of a month?  Or what?  Are they regularly spaced or irregular?

Ansley Manke

Tony Jolibois wrote:
         Hi ferreters,

I'm trying to plot Argos buoy location with a time axis.
The data are in ascii file, so I read this page to create my time
axis :
http://ferret.pmel.noaa.gov/Ferret/FAQ/axes_and_data/time_axis_from_variables.html.

In the end of the page, you can find that :

Note that Ferret variables are represented as single precision real
numbers.  (Axes are represented in double precision, but we are using
a variable to define
the axis and that variable is single precision.) If your timestep is
small, such as minutes, and your times are a century or more after
1-jan-1900, you will need
to use a time origin later than 1-Jan-1900

The problem is that my timestep is so small that enven if I use a new
time origin some step which was not equal are equal after the
calculation.
Can someone know how can I define a variable with a better precision,
or tell me what can I do to define a good time axis ?

Thanks in advance,
Tony
|