[Thread Prev][Thread Next][Index]
irregular box from ij grid to xy grid ...
Hello,
I was wondering the same as Wendy Wang, but for an irregular region and over an irregular grid... I tried your solutions, but it didn't work.
My challenge is the following (I joint 2 graphs to illustrate this):
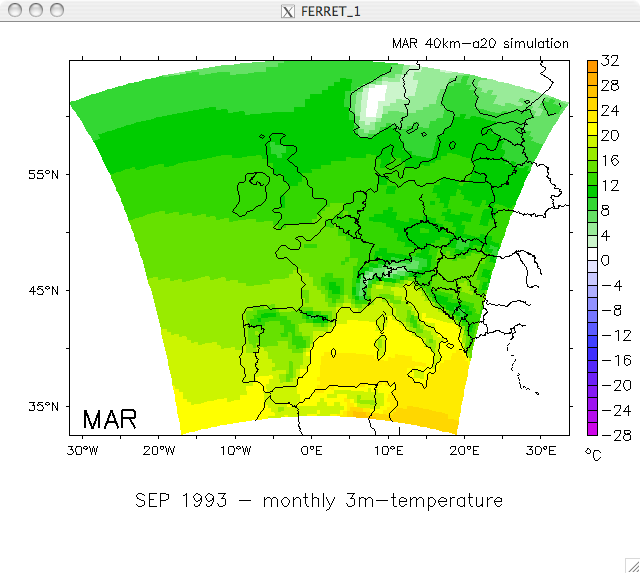
"initialgrid.tiff" : I plot model data on their own grid which is cartesian. I use "shade var,lon,lat" to plot them on a curvilinear grid. But, I have in my data file all longitute and latitude values of the domain:
1> hiver-1994/mar/MAR.a20.1993.09.01-30.nc
name title I J K L
LON Longitude 1:87 1:87 ... ...
LAT Latitude 1:87 1:87 ... ...
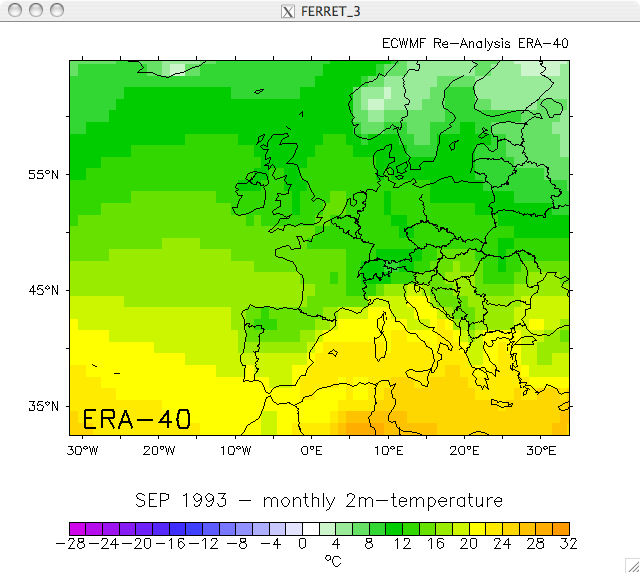
"finalgrid.tiff" : I plot ERA data on their own grid. I'd like to restrict them to the model domain, or at least overlay a kind of "curved quadrilatere" to show where is exactly the model domain.
The problem is that I have to put up with 2 different grids and 2 different spatial resolutions.
Is there anyway to do that 'easily', without writing in/reading a ascii file? I was thinking to define a kind of "mask" variable, looking as stretched and curved trapeze, mask that I coud either plot over the data as a simple line, or use to restrict data to the model domain.
If anyone has any idea...!
Thanks in advance for any answer!
Emilie
____________________________________________________________
Emilie VANVYVE
Physicist, PhD student
Université catholique de Louvain (UCL)
Institut d'astronomie et de géophysique G. Lemaître (ASTR)
Chemin du Cyclotron, 2
1348 Louvain-la-Neuve (Belgium)
Phone : +32-(0)10-473300
Fax : +32-(0)10-474722
E-mail : vanvyve@astr.ucl.ac.be
Web : www.astr.ucl.ac.be
[Thread Prev][Thread Next][Index]
Dept of Commerce /
NOAA /
OAR /
PMEL /
TMAP
Contact Us | Privacy Policy | Disclaimer | Accessibility Statement