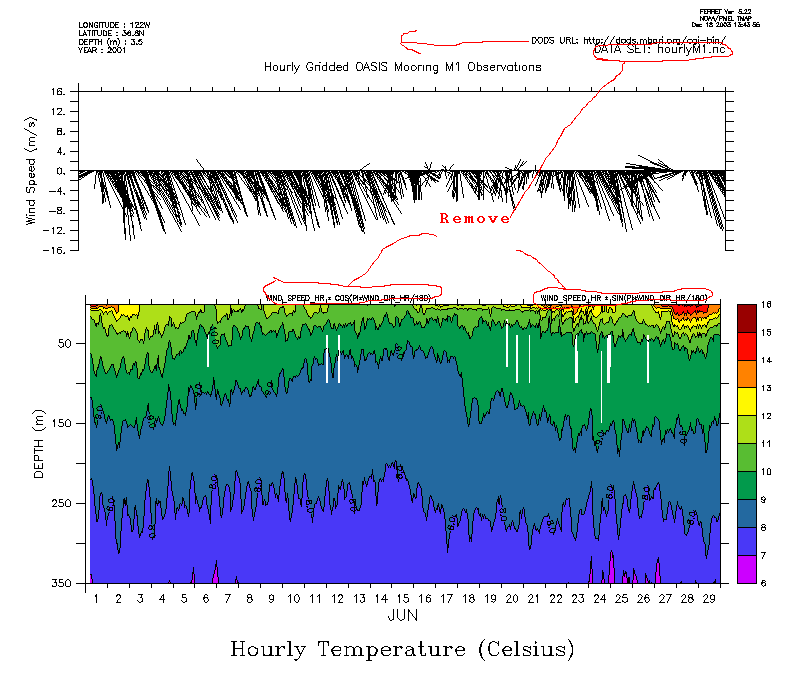
Thanks for the example plot - a good way to show what you
want to do.
There are two approaches you could use here. One is to do a
PLOT/NOLABEL and then add back the labels you want with
the Ferret LABEL command, or do more of the same kind of thing
you've done with GO unlabel.
After making the whole plot as you've done, "ppl list labels" shows
the labels you want to get rid of or move. So the commands for the
upper plot become:
!
! Plot wind vectors with no x axis
!
define viewport/ylimits=0.5,1.0 WV
set viewport WV
plot/set uwnd,vwnd
ppl title ! no title under plot
ppl axset 1,0 ! no lower axis
ppl ylab Wind Speed (m/s)
! Remove the unwanted labels, and also the DODS URL
go unlabel 8
go unlabel 10
go unlabel 11
go unlabel 12
ppl plotuv
! Put the URL label on separately.
label/nouser `($ppl$xlen)/2 - 1.`, 3.2, -1, 0, .09, \
"http://dods.mbari.org/cgi-bin/nph-nc/data/OASISdata/netcdf/hourlyM1.nc"
Ansley Manke
McCann, Mike wrote:
Hello Ferreters,

I'm trying to customize a plot and need some help with making it pretty.

I'd like to move the DODS URL: label to the left so that the whole url shows
and remove the variable names and the DATA SET LABEL:.  I attached a marked
up image that shows what I'd like to do.

Any advice or suggestions are welcomed.

Here's the Ferret commands that produced the plot:


use "http://dods.mbari.org/cgi-bin/nph-nc/data/OASISdata/netcdf/hourlyM1.nc"
set region/t="1-JUN-2001":"30-JUN-2001"

!
! Calculate wind vectors
!
let pi=3.1415926
let uwnd = WIND_SPEED_HR * cos(pi*WIND_DIR_HR/180)
let vwnd = WIND_SPEED_HR * sin(pi*WIND_DIR_HR/180)


!
! Plot temperature contours
!
define viewport/ylimits=0.0,0.7 TV
set viewport TV
contour/fill/set_up temperature_hr
! Remove labels on top
go unlabel 1
go unlabel 2
go unlabel 3
go unlabel 4
go unlabel 5
go unlabel 6
go unlabel 7
go unlabel 8
go unlabel 9
ppl fill
ppl axset 0	! no upper axis
ppl contour/ov

!
! Plot wind vectors with no x axis
!
define viewport/ylimits=0.5,1.0 WV
set viewport WV
plot/set uwnd,vwnd
ppl title   	! no title under plot

ppl axset 1,0	! no lower axis
ppl ylab Wind Speed (m/s)
ppl plotuv


--
Mike McCann (mccann at mbaridotorg)
Monterey Bay Aquarium Research Institute
7700 Sandholdt Road
Moss Landing, CA 95039-9644
Voice: (831) 775-1769 Fax: (831) 775-1646 http://www.mbari.org/rd/iag.htm
