Hello Ansley,

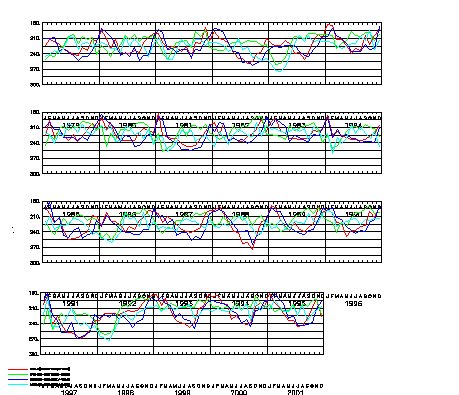
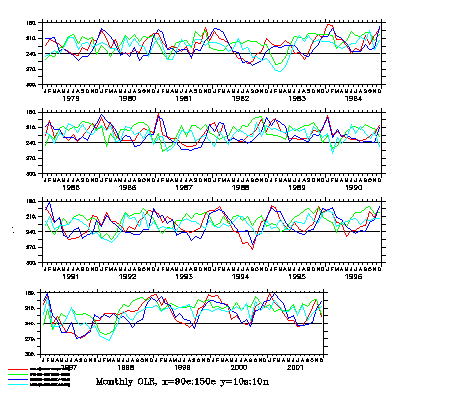
I created 4 graphs in one page as showed in attached file
(4graphs_OLR11.gif) by using attached journal script
(graphs_1_variables.jnl). In this case command of 'go graticule' was
commented.

I want to create the same graphs with extra lines along
their x-axis I uncommented the 'go graticule'. The extra vertical lines
were produced, the problem is the labels (J, F, M, A, ...etc. with the
years) would be away down (see attached 4graphs_OLR12.gif). What I want is
the graphs with vertical and horizontal lines as in 4graphs_OLR12.gif but
the labels are close as in 4graphs_OLR11.gif. How can I make such kind of
graphs? If it is possible even I want to add one vertical line for every 3
months (M,J,S,D) along the x-axis.

The problem did not occur when I created one graph in one page (with out
commend of 'ppl axlen ...'). I have been trying also to use 'go gridlines'
or 'go gridxy' but I did not get
 any success. With command of 'go
gridlines hdelta vdelta' would produce vertical in one spot that I think
is not following 'hdelta' and 'vdelta'. With command of 'go gidxy', the
lines would be not at the places that I want (I modified command line 'PPL
LEV () (..,..,..)' in the gridxy.jnl, shifting accumulatively).

I am using ferret 5.22 on sgi mechine. Thank you for your help. RGDS,

mrp
cancel data/all
use/regulart olr.monthly.7901.nc        !!! olr
use/regulart u850.monthly.7901.nc       !!! uwnd
use/regulart u500.monthly.7901.nc       !!! uwnd
use/regulart u200.monthly.7901.nc       !!! uwnd
!define viewport /xlim=0.0125:0.990625 /ylim=0.675:0.975 ul
!define viewport /xlim=0.0125:0.990625 /ylim=0.450:0.750 ur
!define viewport /xlim=0.0125:0.990625 /ylim=0.225:0.525 ll
!define viewport /xlim=0.0125:0.799032 /ylim=0.000:0.300 lr
define viewport /xlim=0.0125:0.990625 /ylim=0.675:0.900 ul
define viewport /xlim=0.0125:0.990625 /ylim=0.450:0.675 ur
define viewport /xlim=0.0125:0.990625 /ylim=0.225:0.450 ll
define viewport /xlim=0.0125:0.799032 /ylim=0.000:0.225 lr
set window/size=0.25
!set window/aspect=0.75
!set window/aspect=1.5
palette bluescale
show data/full
define grid/like=monthly[d=1]  new_grid
define grid/like=um850[d=2]  new_grid2
let A = 240*l/
l[gt=new_grid@asn]
let B = 0*l/l[gt=new_grid2@asn]

!1
!set mode metafile
set viewport ul
ppl axlen 11.0,2.0;
go graticule
let data11 = monthly[d=1,x=90e:120e@ave,y=10s:0@ave,l=1:72];
let data12 = monthly[d=1,x=90e:120e@ave,y=0:10n@ave,l=1:72];
let data13 = monthly[d=1,x=120e:150e@ave,y=10s:0@ave,l=1:72];
let data14 = monthly[d=1,x=120e:150e@ave,y=0:10n@ave,l=1:72];
let data14 = monthly[d=1,x=120e:150e@ave,y=0:10n@ave,l=1:72];
go remove_logo; plot/nolabels/vlimits=180:300:-15 A[l=1:72], data11, data12, data13, data14
set viewport ur
ppl axlen 11.0,2.0;
let data21 = monthly[d=1,x=90e:120e@ave,y=10s:0@ave,l=73:144];
let data22 = monthly[d=1,x=90e:120e@ave,y=0:10n@ave,l=73:144];
let data23 = monthly[d=1,x=120e:150e@ave,y=10s:0@ave,l=73:144];
let data24 = monthly[d=1,x=120e:150e@ave,y=0:10n@ave,l=73:144];
go remove_logo; plot/nolabels/vlimits=180:300:-15 A[l=73:144], data21, data22, data23, data24
set viewport
 ll
ppl axlen 11.0,2.0;
let data31 = monthly[d=1,x=90e:120e@ave,y=10s:0@ave,l=145:216];
let data32 = monthly[d=1,x=90e:120e@ave,y=0:10n@ave,l=145:216];
let data33 = monthly[d=1,x=120e:150e@ave,y=10s:0@ave,l=145:216];
let data34 = monthly[d=1,x=120e:150e@ave,y=0:10n@ave,l=145:216];
go remove_logo; plot/nolabels/vlimits=180:300:-15 A[l=145:216], data31, data32, data33, data34
set viewport lr
ppl axlen  9.7,2.1;
let data41 = monthly[d=1,x=90e:120e@ave,y=10s:0@ave,l=217:276];
let data42 = monthly[d=1,x=90e:120e@ave,y=0:10n@ave,l=217:276];
let data43 = monthly[d=1,x=120e:150e@ave,y=10s:0@ave,l=217:276];
let data44 = monthly[d=1,x=120e:150e@ave,y=0:10n@ave,l=217:276];
plot/set_up/title="Monthly OLR, x=90e:150e y=10s:10n" /vlimits=180:300:-15 A[l=217:276]
go remove_logo; go unlabel 4; go unlabel 5; go unlabel 6; ppl plot
plot/over data41
plot/over data42
plot/over data43
plot/over data44
!cancel mode metafile
!spa
wn gksm2ps -o 4graphs_OLR.ps metafile.plt
frame/file= 4graphs_OLR12.gif

