I would like to display state and country political boundaries forHi,
Australia in my plots. I would greatly appreciate your help with
hints how to prooceed with this.
Look at this server
http://crusty.er.usgs.gov/coast/getcoast.html
And process as follows:
----------------------
1) Select the database you want.
2) Select Mapgen as Coast Format Options
3 ) Submit your request
4) Save the data file
----------------------
5) With your favorite editor, change
# -b to -1E+34 -1E+34
With Vi editor, type:
:1,%s/# -b/-1E+34 -1E+34/g
----------------------
6) Note the number of lines
wc -l <filename>
----------------------
7) With Ferret:
def axis/x=1:<number of lines>:1 vector_length
def grid/x=vector_length vector_grid
file/var=lon,lat/g=vector_grid france.dat
plot/vs/line lon,lat
----------------------
8) Add rivers or/and polical boundaries from other files
----------------------
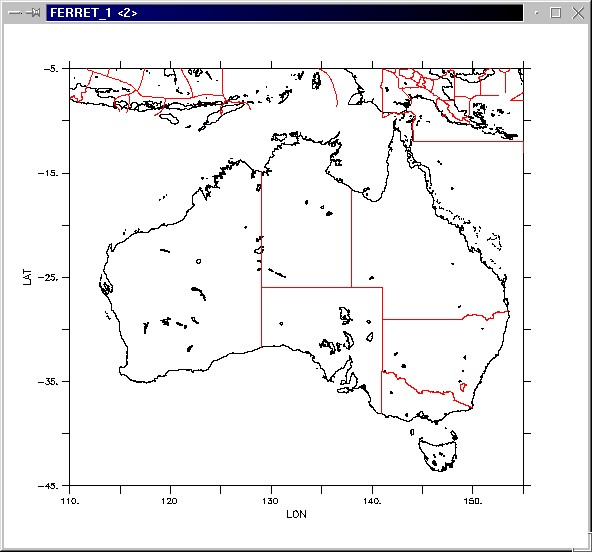
9) You get:
See attached file:
Hope that what you were looking for.
Patrick
--
Patrick BROCKMANN (LSCE/CNRS-CEA Saclay)
Laboratoire des Sciences du Climat et de l'Environnement
Unite mixte de recherche CNRS-CEA
L'Orme des Merisiers - Bat.701 - CEA/Saclay
91191 GIF sur YVETTE cedex - FRANCE
Tel : 01 69 08 86 79 - Fax : 01 69 08 77 16
mailto:brock@lsce.saclay.cea.fr