 Bill Chadwick: Galapagos bathymetry
(Click on the map to view a larger jpg image)
OTHER VERSIONS OF THE MAP ABOVE (available via FTP):
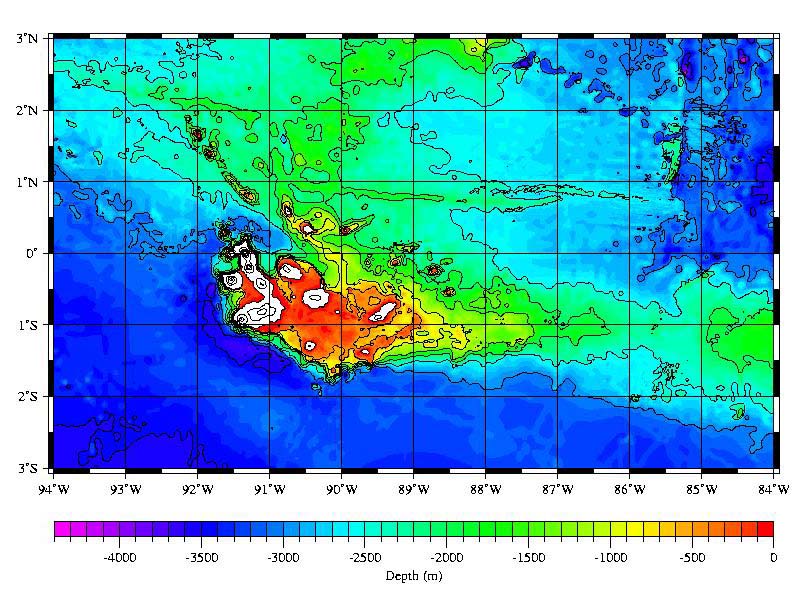
1) The version above (rainbow colors, 500-m contours, no shading): JPG
or compressed Postscript
2) Same colors as above, 100-m contours and no shading: JPG
or compressed Postscript
3) Same colors as above, no contours and with shading: JPG
or compressed Postscript
4) Color table #2 (brighter), no contours, with shading: JPG
or compressed Postscript
5) Color table #3 (more subdued), no contours, with shading: JPG
or compressed Postscript
6) Color table #4 (even more subdued), no contours, no shading: JPG
or compressed Postscript
7) Same colors as above, no contours, with shading: JPG
or compressed Postscript
8) Same colors as above, with 100-m contours and no shading: JPG
or compressed Postscript
9) Same colors as above, with 100-m contours and shading: JPG
or compressed Postscript
10) No colors, contours only, (500-m contours): JPG
or compressed Postscript
To uncompress a Postscript file after you download it, type "uncompress filename" on a UNIX platform, use StuffIt Expander (or other compression software) on a MacIntosh or PC.
SOURCES OF DATA:
Shown above is a bathymetric grid of the Galapagos area (-94 to -84 in longitude; -3 to +3 in latitude; ~1-km grid cell size; 1001 x 601 pixels), which I created by merging all bathymetric datasets that were available as of 1994. From lowest to highest resolution this includes:
- DBDB5 global dataset, spaced at 5-minute intervals
- NOAA/Marine Geophysical Data Center ship-track bathymetric data
- Digitized hydrographic maps (topographic contours above sealevel and individual near-shore soundings below sealevel), courtesy of Dave Christie and Bob Duncan, Oregon State University
- SeaMARC II data from the 87 30'W overlapping spreading center (courtesy of Laura (Perram) Penvenne and Ken Macdonald, UCSB) and the Ecuador Rift (courtesy of Suzanne Carbotte and Ken Macdonald, LDEO and UCSB)
- SeaBeam multibeam sonar bathymetry
- data from the Scripps Institute of Oceanography database
- data collected by Dave Christie and Bob Duncan, Oregon State University, in 1990
- data collected by Bob Embley, NOAA/NURP/VENTS, in 1985
- U.S. Navy SAS data collected during the 1970's
A plot of the distribution of data points that were used to make the grid is available as a GIF or as a Postscript file.
HOW WAS THE GRID MADE?
The grid was made in 2 steps: first, all the data were assembled, edited, gridded, and then filtered with a 9-km wide window. Secondly, the high-resolution data (digitized hydrographic and topographic data, the SeaMARC II data, and the SeaBeam data) were gridded separately and then overlain on the first grid. This has the effect of preserving the detail of the best data where it exists, while smoothing out the noise in the lower-quality data.
GETTING A COPY OF THE GRID OR THE RAW DATA:
You are welcome to use this data in any publication or proposal, if it is accompanied by an acknowledgement such as "Bathymetric data compiled by William Chadwick, Oregon State University". If you would like to download a grid of this bathymetry (via ftp), click on one of the following links. The grid is available in GMT (Generic Mapping Tools) version 3 grid format ("galap.grd") or ArcInfo Interchange format ("galp1000.e00").
... Note, you probably need to click and hold down with your *right* mouse button and then choose "Save link as..." from the pop-up menu (this tells your browser that this is a binary file that you want to save to disk, not display on the screen, because it probably doesn't know what kind of file ends in *.grd or *.e00).
If you would like the raw data (ASCII xyz, longitude/latitude/depth records) from which my grid was made (for example, if you want to try gridding it yourself with your own software), you can download (ftp) the data in two files. One file is all the data, the other file is only the high-resolution data (see the notes above on "How the grid was made"). For both links below, click with your right mouse button to save the data to a file (otherwise it will just start scrolling on your screen). The file with all the data is "galapall.xyz.Z", (this file is 4.6 Mb compressed, and 15.7 Mb uncompressed). The file with only the high-resolution data is "galaptop.xyz.Z", (this file is 3.0 Mb compressed, and 10.9 Mb uncompressed). Your browser may uncompress the files automatically in transit, but if not see the notes below the map above for information on how to uncompress these files.
PROBLEMS WITH THE GRID
The grid is not perfect. The distribution of data is very uneven, the data are very sparse in much of the area, and there are places where different datasets do not match. For example, south of the island platform there are hardly any data, and it is obvious that the few ship tracks do not match the underlying DBDB5 data very well (they are a little bit shallower). I have editted out obvious bad data points, but have not tried to rectify conflicting data sets by shifting navigation, or depth, or sound velocity, etc. For example, Doug Wilson (UCSB) sent me a list of potential problems with specific ship-track files, but I have not done anything about them. There are many more multibeam surveys that have been collected around the islands and along the Galapagos Rift since 1994 (see the Marine Geoscience Data System). There is definitely more work that could be done to improve the dataset...
RELATED LINKS
Chris Fox and Bob Dziak used this map to plot T-phase (earthquake) epicenters from their Autonomous Hydrophone Array (AHA).
You can also check out the GPS and Gravity monitoring project on Fernandina and Sierra Negra volcanoes that I am involved in.
...back to Bill Chadwick's homepage
...back to EOI Program Geology page
...back to EOI Program homepage
last updated: 04/04/07