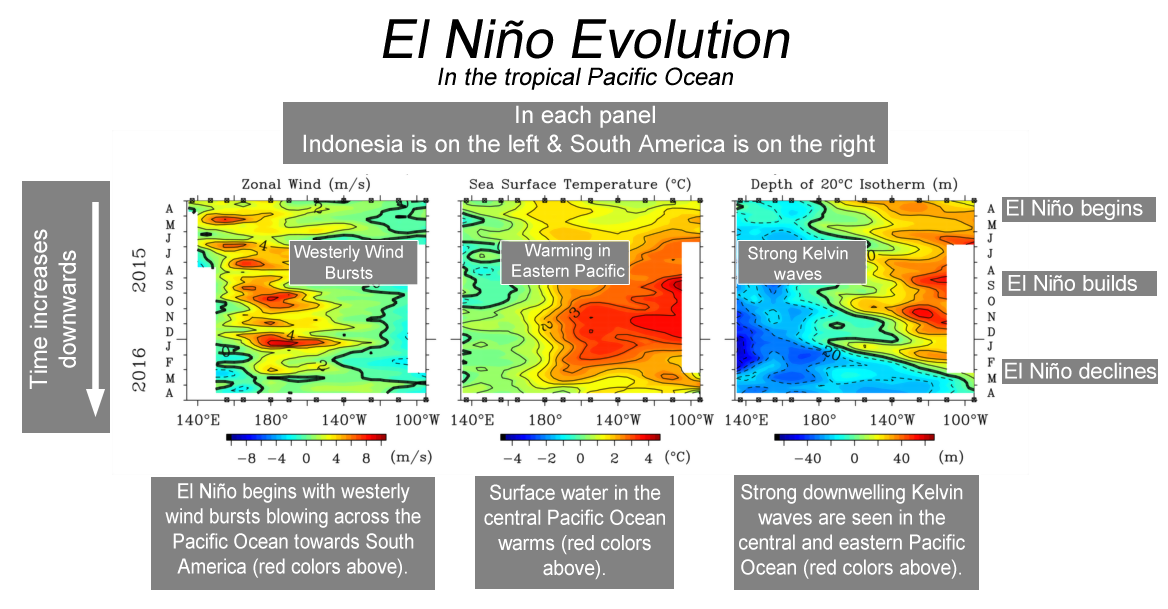
The Equatorial Pacific Ocean 'At a Glance'
Click for annotated version of graphic explaining how it illustrates the evolution of El Niño.
Explanation
- each panel is a time vs longitude plot near the equator (2ºN to 2ºS) in the Pacific Ocean
- in each panel, Indonesia is on the left and South America is on the right
- in each panel, time increases downwards, and A M J etc. are the months April, May, June, etc.
- panels show deviations from normal conditions for east-west wind (left panel), temperature (middle panel) and the depth of the water which is 20ºC (right panel)
- read about Kelvin waves and their role in El Niño and La Niña from NASA Science News
- read about Kelvin waves and their role in El Niño and La Niña from climate.gov


