What's New Archive
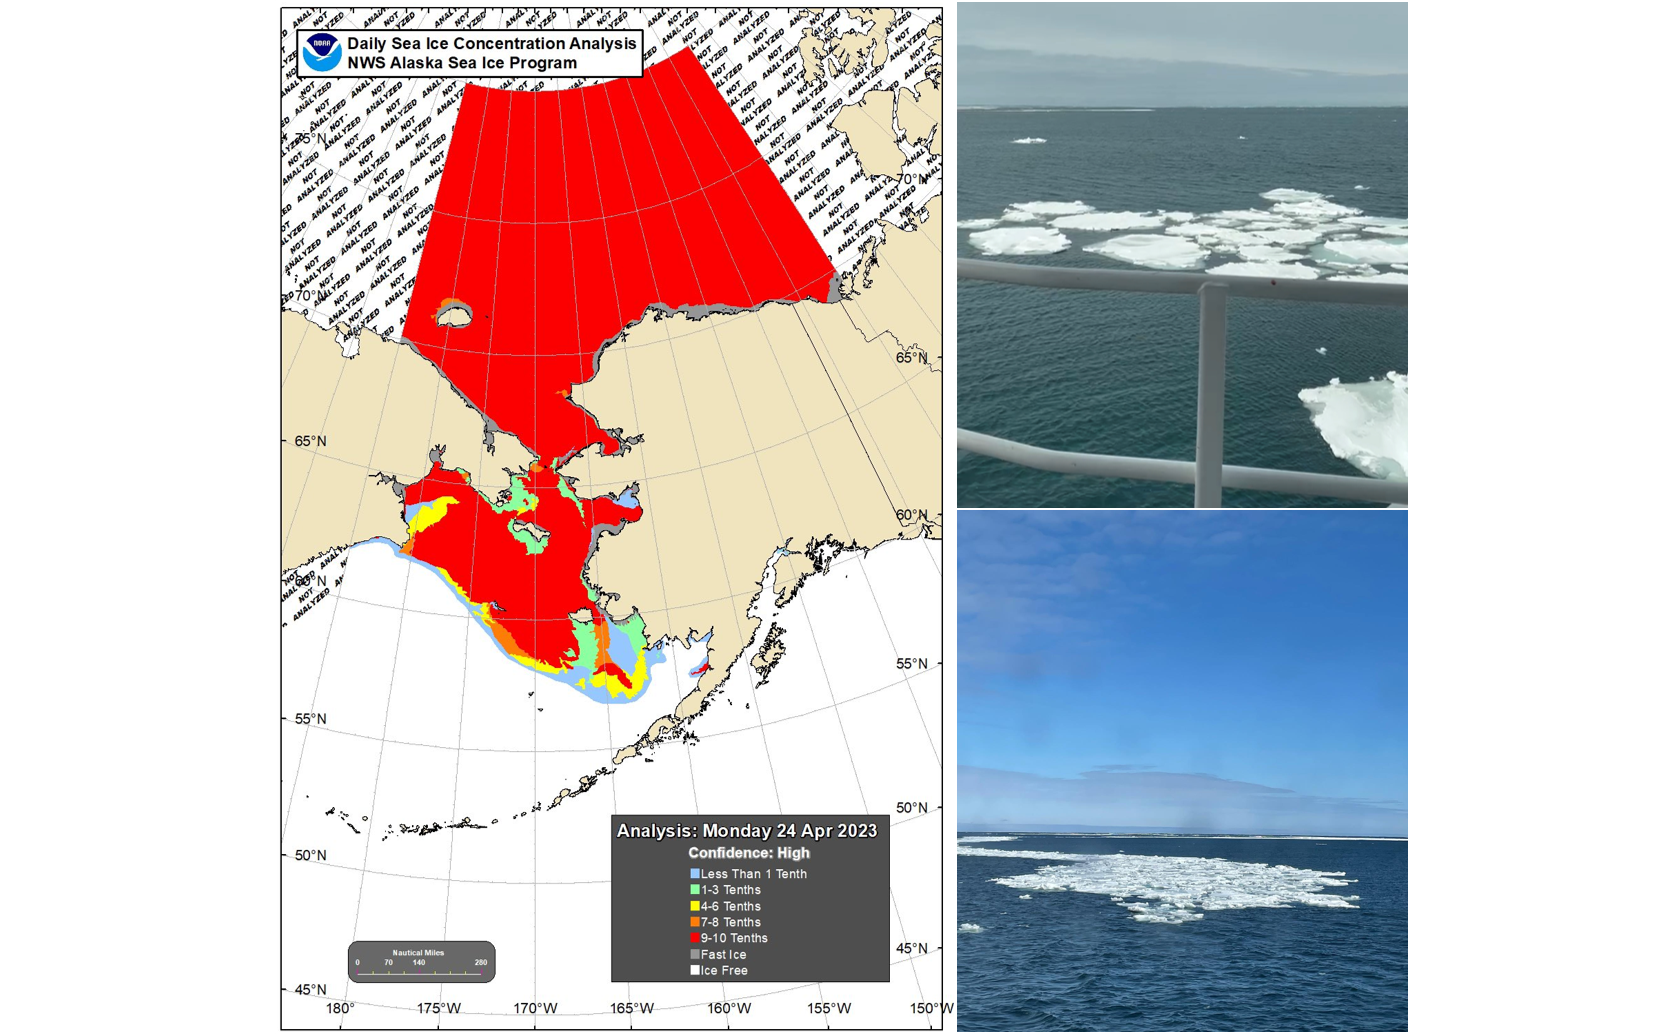
Annual Ecosystems & Fisheries-Oceanography Coordinated Investigations (EcoFOCI) Survey in the Bering Sea encounters sea ice (right images) for the first time since 2012. The map (left) shows sea ice extent in the region on April 24, 2023. Photo Credits: Shaun Bell
April 21 - May 8 - NOAA PMEL oceanographers and colleagues continue leading an annual effort to collect key data in understanding the Bering Sea. This important research cruise provides key insights to monitor events such as sea-ice loss and the cold pool in the region and how these are impacting the Arctic ecosystem. This year’s cruise started out a bit different!
For the first time since 2012, the ice extent in the Bering Sea is impacting the survey and researchers had to alter their cruise plan as the ice is at and around several of the mooring and sampling sites. While not thick ice, lead scientist and NOAA oceanographer Phyllis Stabeno was surprised. “I did not expect to see ice this late on the shelf,” she said. In this region, ice arrives in the Bering Sea in the fall and typically melts and recedes in spring, - limiting when research vessels can be in the area.
2012 was a record breaking year. The melt season of 2012 started out at a sluggish pace. Around mid-April, sea ice extent was close to the 1979–2000 average for that time of year (the maximum ice extent typically occurring in March). However, soon after that the decline began to accelerate rapidly.
Stabeno took this as a unique and unexpected opportunity to safely sample around the ice edge. Most vessels are not made to break ice - but they can go near this melting ice region. As the ice continues to melt, the science team will resume their planned research.
This spring mooring cruise brings together scientists from NOAA’s PMEL and Alaska Fisheries Science Center, the University of Washington, US Fish and Wildlife, and the University of Alaska. While aboard the NOAA Ship Oscar Dyson, the scientists will service a biophysical mooring array. They will also collect water samples of conductivity (salinity), temperature, depth (CTD) profiles, zooplankton, ichthyoplankton, nutrients and chlorophyll samples. As well as conduct collaborative research including on harmful algal blooms, omics, and zooplankton machine learning. Results from these observations and experiments will help describe important ecosystem linkages among climate, plankton, fishes, birds and mammals.
EcoFOCI will be field testing and using several innovations this spring. Innovations and technologies such as these aim to enhance shipboard and mooring research with advanced and increased data collection. These include the deployment of a modified ‘high-latitude’, more robust surface mooring at M2 and a shallow-water glider. This is the 29th consecutive year the M2 mooring will be deployed. In 2022 a combination of the pandemic, sea ice, and a storm provided researchers a new perspective from NOAA’s longest operating biophysical mooring site in the US Arctic. Learn more about that in a NOAA Story Map (https://storymaps.arcgis.com/stories/1b413464b13c4aa381b48ecd5c89ed50).
This is the first of five NOAA EcoFOCI program research cruises planned between April and October in the Alaska region.
Learn more about mooring arrays and the EcoFOCI spring cruise on NOAA Fisheries 2022 blog.
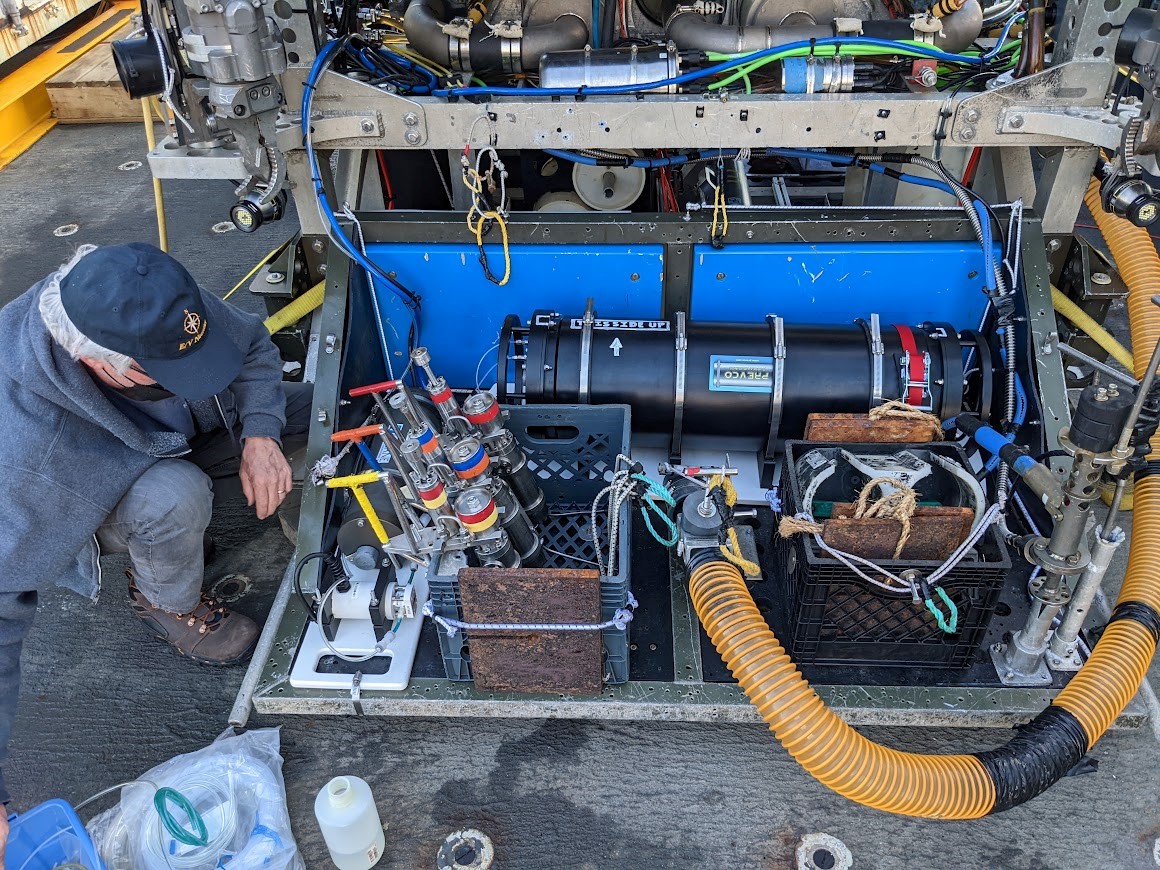
Dave Butterfield checking fluid connections to the methane spectrometer (large black pressure case) mounted at the back of ROV Jason’s tool sled. Other equipment used on this dive include the auxiliary pump at left, 3 titanium gas-tight sampler with colored T-handles, a suction sampler (large orange hose) and the Hydrothermal Fluid Sampler intake nozzle at far right. Photo Credit: Andrew Fahrland (OKSI)
NOAA PMEL, University of Washington and OptoKnowledge Systems, Inc. (OKSI) successfully conducted the first deep water test of a new methane analyzer to measure the concentration and carbon isotope ratio of methane near Axial Seamount. This new instrument can collect data that will improve scientists’ understanding of carbon cycling, greenhouse gasses, and sub-seafloor chemosynthetic reactions.
After 3 years of testing and development, the analyzer was mounted on the remotely operated vehicle Jason and coupled to PMEL’s hydrothermal fluid and particle sampler (HFS) during a recent cruise on the Research Vessel Thompson. The methane analyzer combines a novel laser absorption spectroscopy gas sensor with a membrane-free approach to water sampling. While the research cruise had to be cut short, the team successfully was able to collect valuable data and coordinate samples for cross-calibration during one ROV dive.
While collecting data with the methane analyzer, researchers simultaneously sampled the same fluid in gas-tight samplers attached to the fluid manifold and in custom samplers that are part of the HFS. Methane concentrations analyzed onboard the R/V Thompson by gas chromatography on fluid samples from HFS piston and bag samplers agree well with the in-situ methane concentrations determined by the analyzer.
Ultimately, the instrument worked well on the ROV and it is expected that the methane spectrometer will have many useful applications.
Learn more about this technology development and methane work on PMEL’s Earth Ocean Interactions research page.
Instrument Development:
The methane analyzer was developed by OKSI with initial funding from the NOAA Small Business Innovation Research (SBIR) Program. The SBIR Program, also known as America’s Seed Fund, awards seed funding to U.S. small businesses to support high-risk, high-reward research and development of new technologies. In 2016, OKSI received a NOAA SBIR Phase I award to develop an instrument that could analyze underwater gasses, specifically methane and its isotopes. The company was awarded follow-on Phase II funding in 2017.
The effort has since transformed into a Phase III collaboration with PMEL. OKSI and NOAA PMEL were funded in 2019 through a National Ocean Partnership Program (NOPP) grant with NOAA Ocean Exploration support to continue development of the methane spectrometer and deploy it in deep water. In 2021, PMEL and OKSI successfully completed shallow-water methane concentration measurements in Puget Sound. The Puget Sound test showed that the instrument can take measurements of methane concentration in-situ and report those measurements in real-time to an operator on board a ship with an update rate approximately every 6 minutes.
More About the Sensor:
For the new spectrometer instrument, it is important to verify that the in-situ measurements agree with established discrete sampling and analysis for methane concentration and carbon isotope ratio. The PMEL hydrothermal fluid sampler, first developed in 1998, will deliver warm hydrothermal fluids from diffuse vents with elevated methane concentrations to the methane spectrometer and simultaneously take coordinated discrete samples for laboratory analysis of concentration and carbon isotope ratio to cross-calibrate the in-situ measurements from the methane sampler. Tamara Baumberger is collecting samples in specialized gas-tight samplers for carbon isotope and methane concentration analysis.
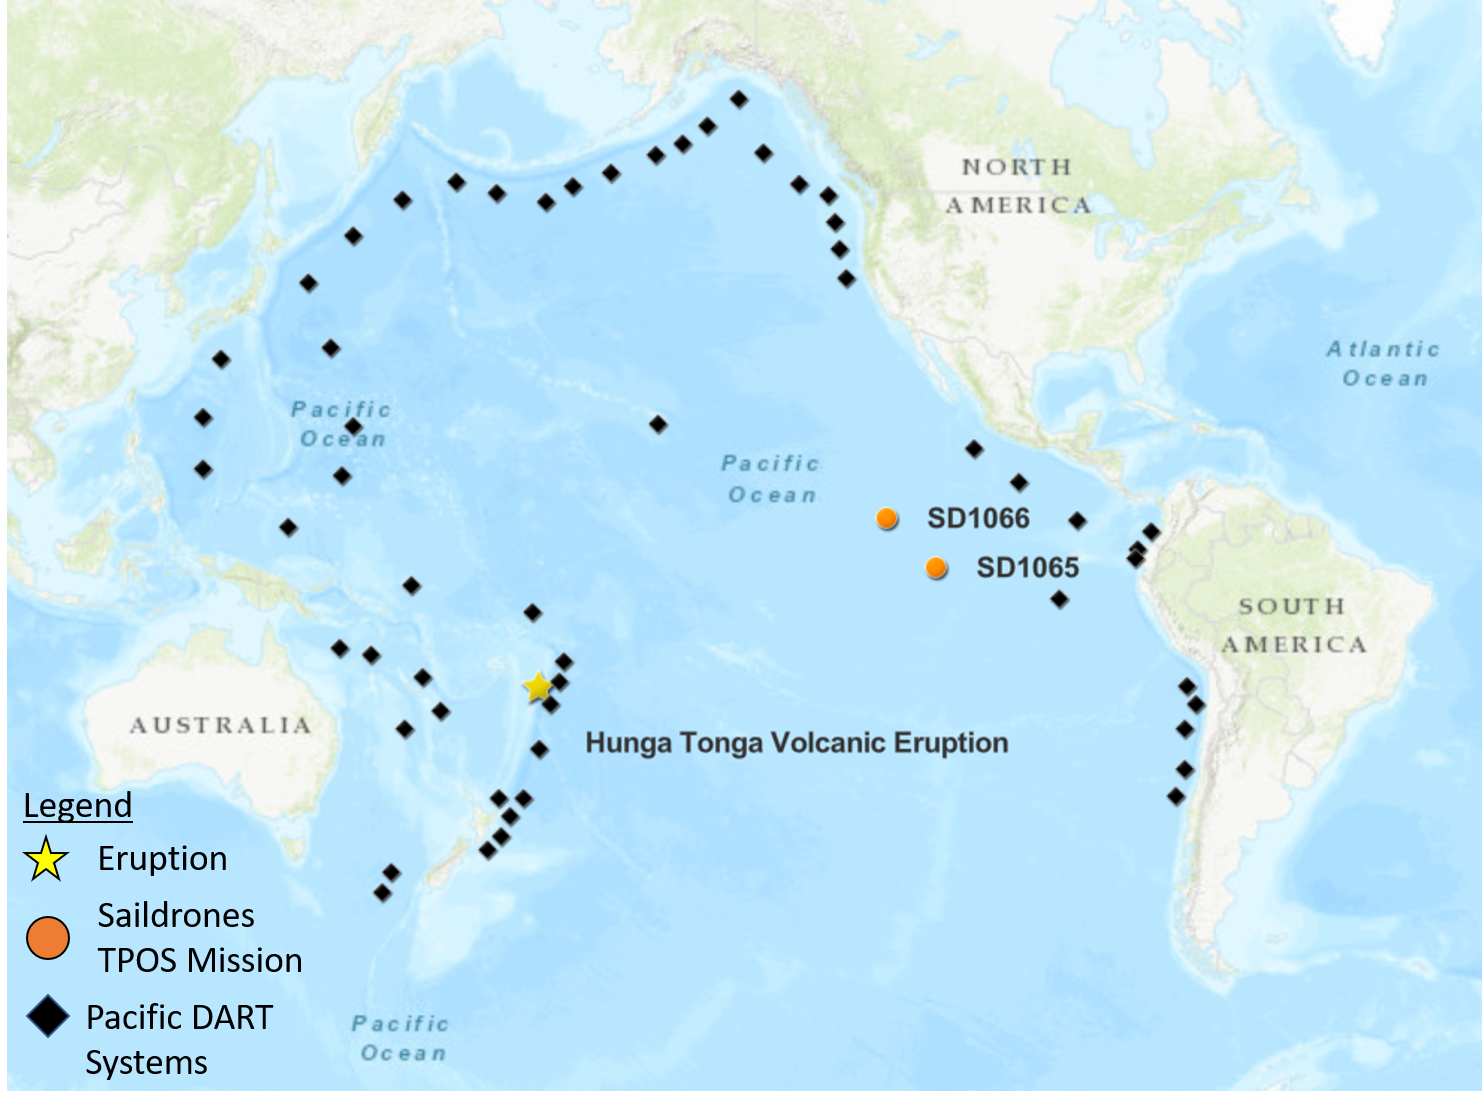
Map of the tropical Pacific showing the positions of DART buoys operated by NOAA and international partners as well as saildrone 1065 and 1066 relative to the Hunga Ha’apai Volcano located in the Pacific island nation of Tonga, which is an archipelago consisting of more than 170 islands.
On January 15, 2022, the Hunga Tonga-Hunga Ha’apai volcano erupted off the coast of Tonga in the South Pacific Ocean, generating a tsunami and triggering tsunami alerts around the world. Most tsunamis are commonly caused by earthquakes and only about 5% of tsunamis are generated from volcanic activity (ITIC), making this a rare event captured by NOAA’s observing instruments.
Buoys and Saildrone uncrewed surface vehicles additionally recorded an air pressure wave associated from the eruption. The pressure wave from the volcano explosion was detected as far as the Mediterranean Sea and traveled about 312 meters/second (697 miles per hour) and circled the Earth three times before dissipating. The Krakatau eruption in 1883 was the last event of such scale. Krakatau produced similar air pressure waves and a devastating tsunami that claimed the lives of ~36,000 people and the destruction of hundreds of coastal towns and villages.
Deep-ocean Assessment and Reporting of Tsunamis (DART) systems are strategically deployed by NOAA and international partners around the Pacific Ocean to detect tsunami waves and send data in realtime to tsunami warning centers. These systems recorded the propagating tsunami across the Pacific and prompted expansion of the tsunami alerts for many coastlines in the Pacific. Those warnings may have saved lives at many coastlines that were later flooded by the waves, some as far as the Pacific coast of Peru.
Along with the tsunami wave amplitudes measured by the DART system, the atmospheric pressure wave associated with a shock-wave emanating from the volcano explosion was measured. The air pressure signal detected by weather station buoys is the leading signature before the tsunami wave train and may provide clues for the mechanism of this unusual tsunami generation. However, given that the pressure signal mixed with the tsunami amplitudes in the data, high-resolution air pressure measurements are needed to decipher the DART tsunami records.
Coincidentally, two NOAA-Saildrone drones were approximately 3500 nautical miles (~4028 miles) away from the eruption, the distance to drive between Anchorage, Alaska and Miami, Florida, in the eastern tropical Pacific Ocean. The two drones are part of a 6-month, ongoing Tropical Pacific Observing System (TPOS) mission targeting the eastern tropical Pacific hurricane genesis region and El Niño Southern Oscillation (ENSO) development. The two drones were able to detect an atmospheric pressure jump in high-resolution measurements, capturing crucial information associated with the remote volcanic activity in an observationally-sparse region of the ocean for post-analysis with the DART tsunami records.
The phenomena recorded in the data is unique and additional research and development is needed to accommodate these types of tsunami events in the model used to forecast tsunami events. PMEL tsunami researchers are analyzing the data from the various platforms to get a better understanding of this rare event.
PMEL has also previously studied the dynamics of a smaller scale eruptive activity of this volcano using acoustic data and will uncover and analyze additional acoustic data from hydrophones deployed across the Pacific when they are recovered later this year.
Read more on the TPOS 2021 Saildrone Mission on the blog page.
More about the event can be found on the PMEL Tsunami Research group events page.
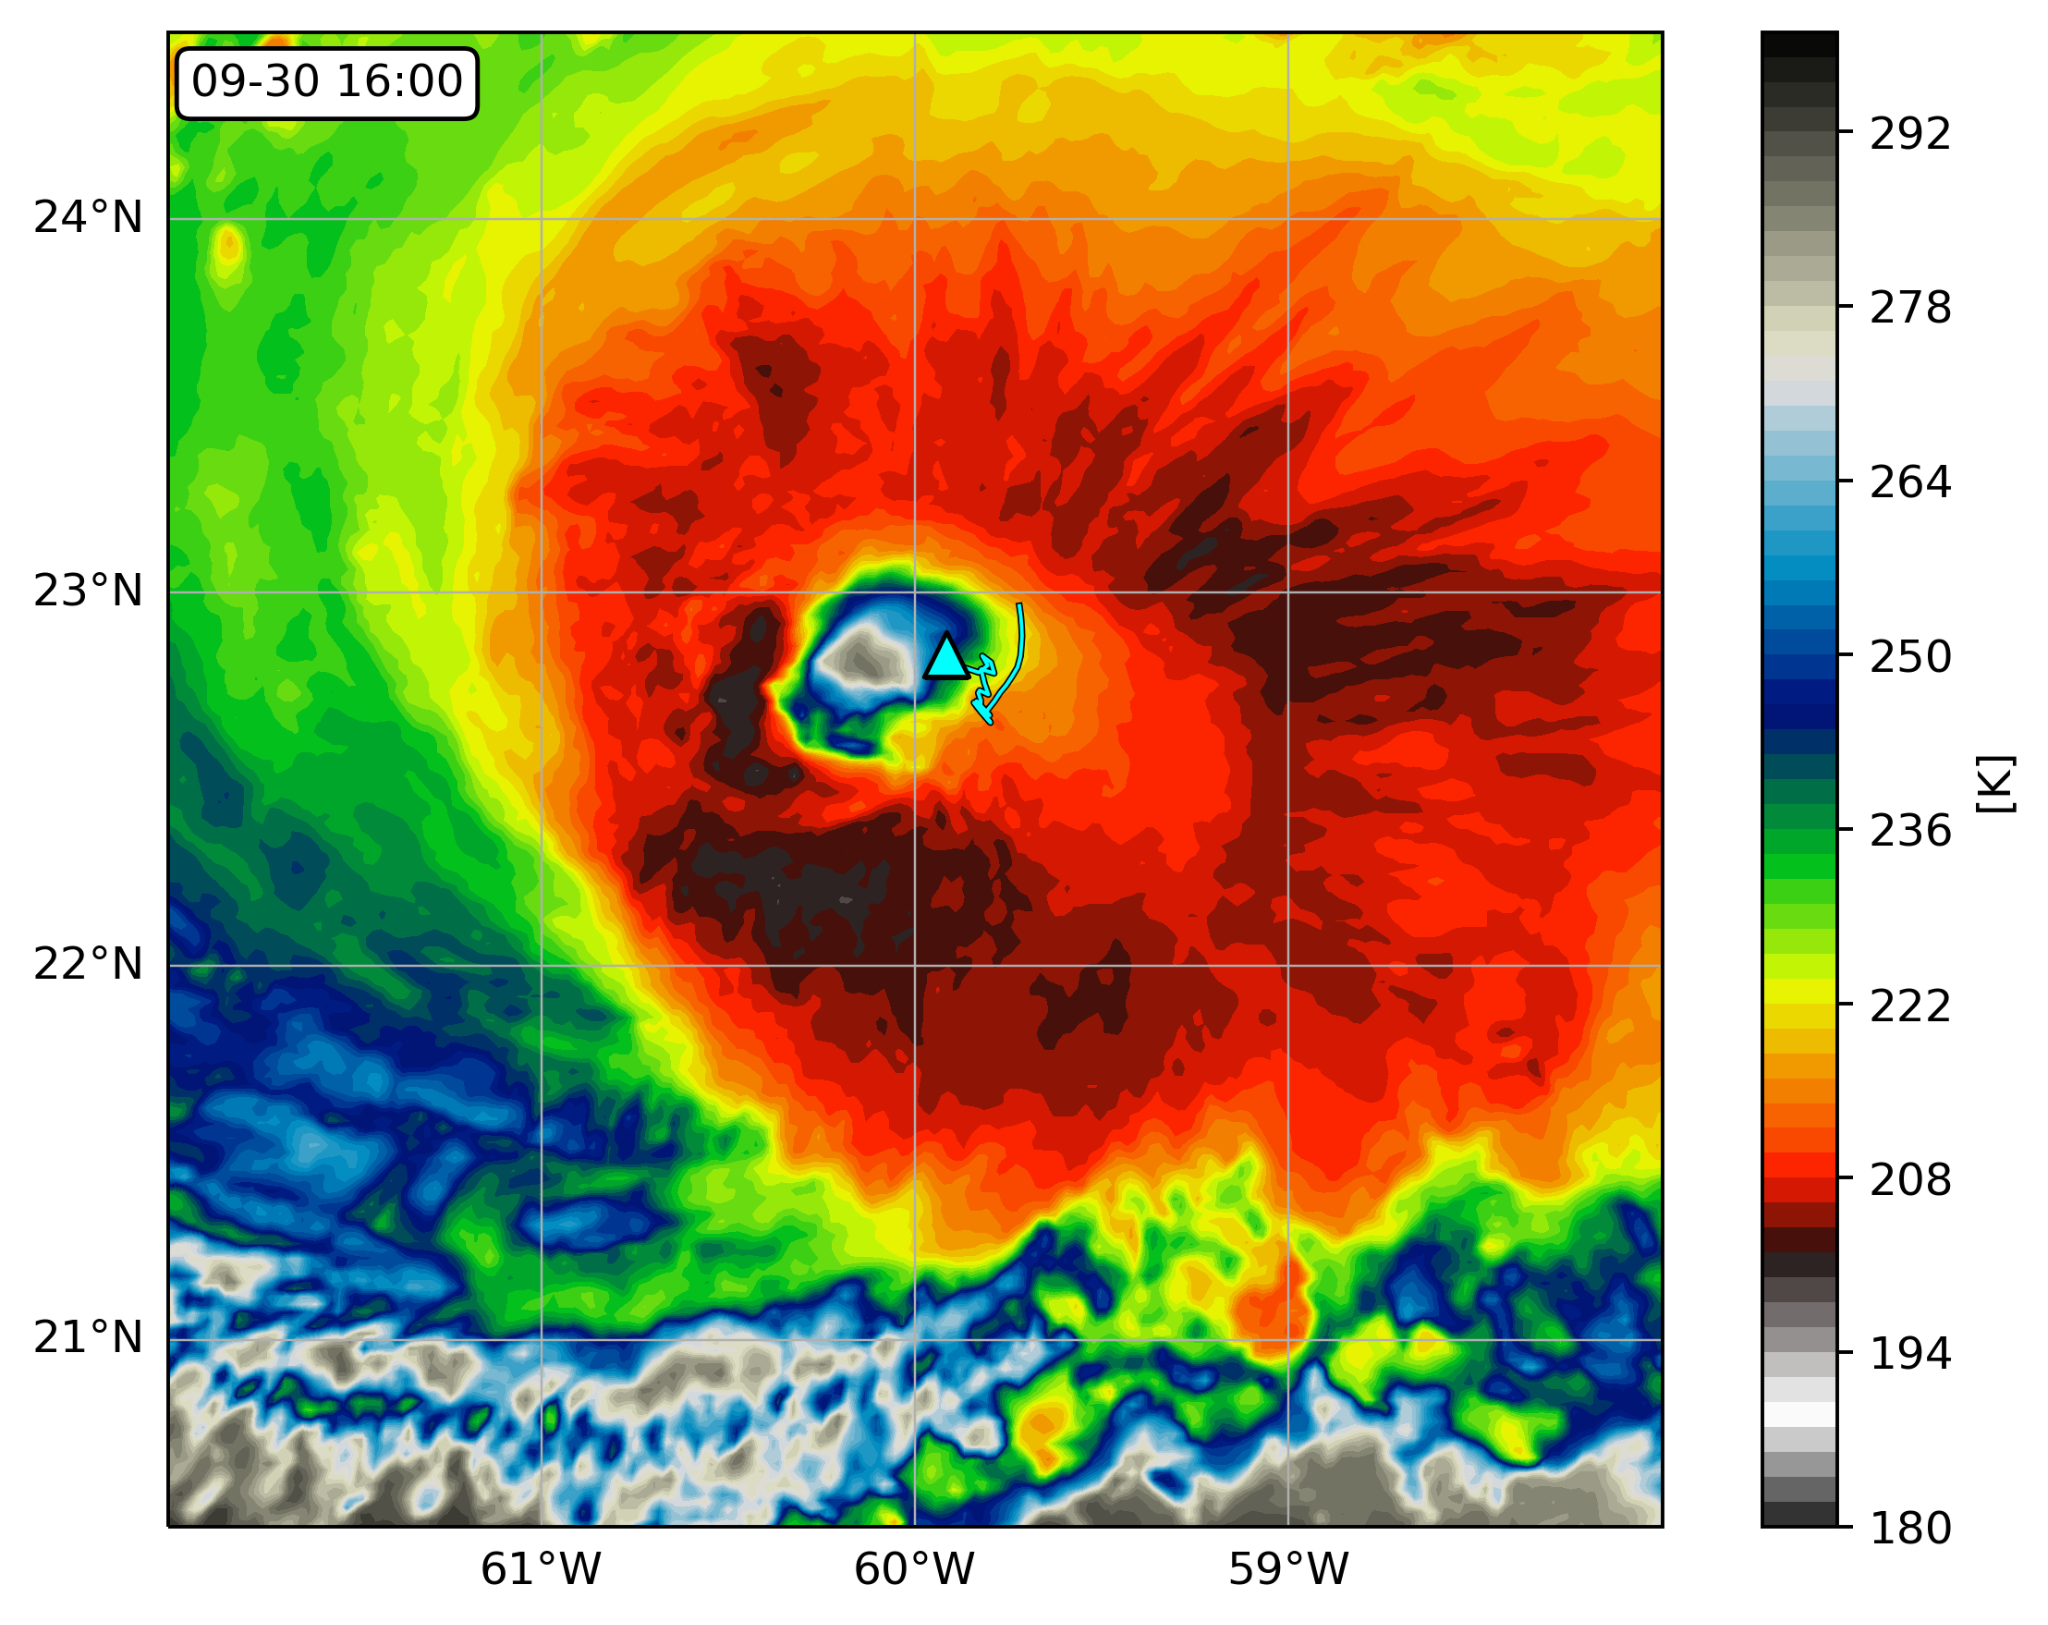
Saildrone 1045 location (triangle) overlaid on an infrared image from NOAA geostationary satellite (colors) at 16:00 UTC September 30, 2021. The saildrone track (light blue line) starts at 04:00 UTC on the same day. Courtesy of Edorado Mazza/University of Washington.
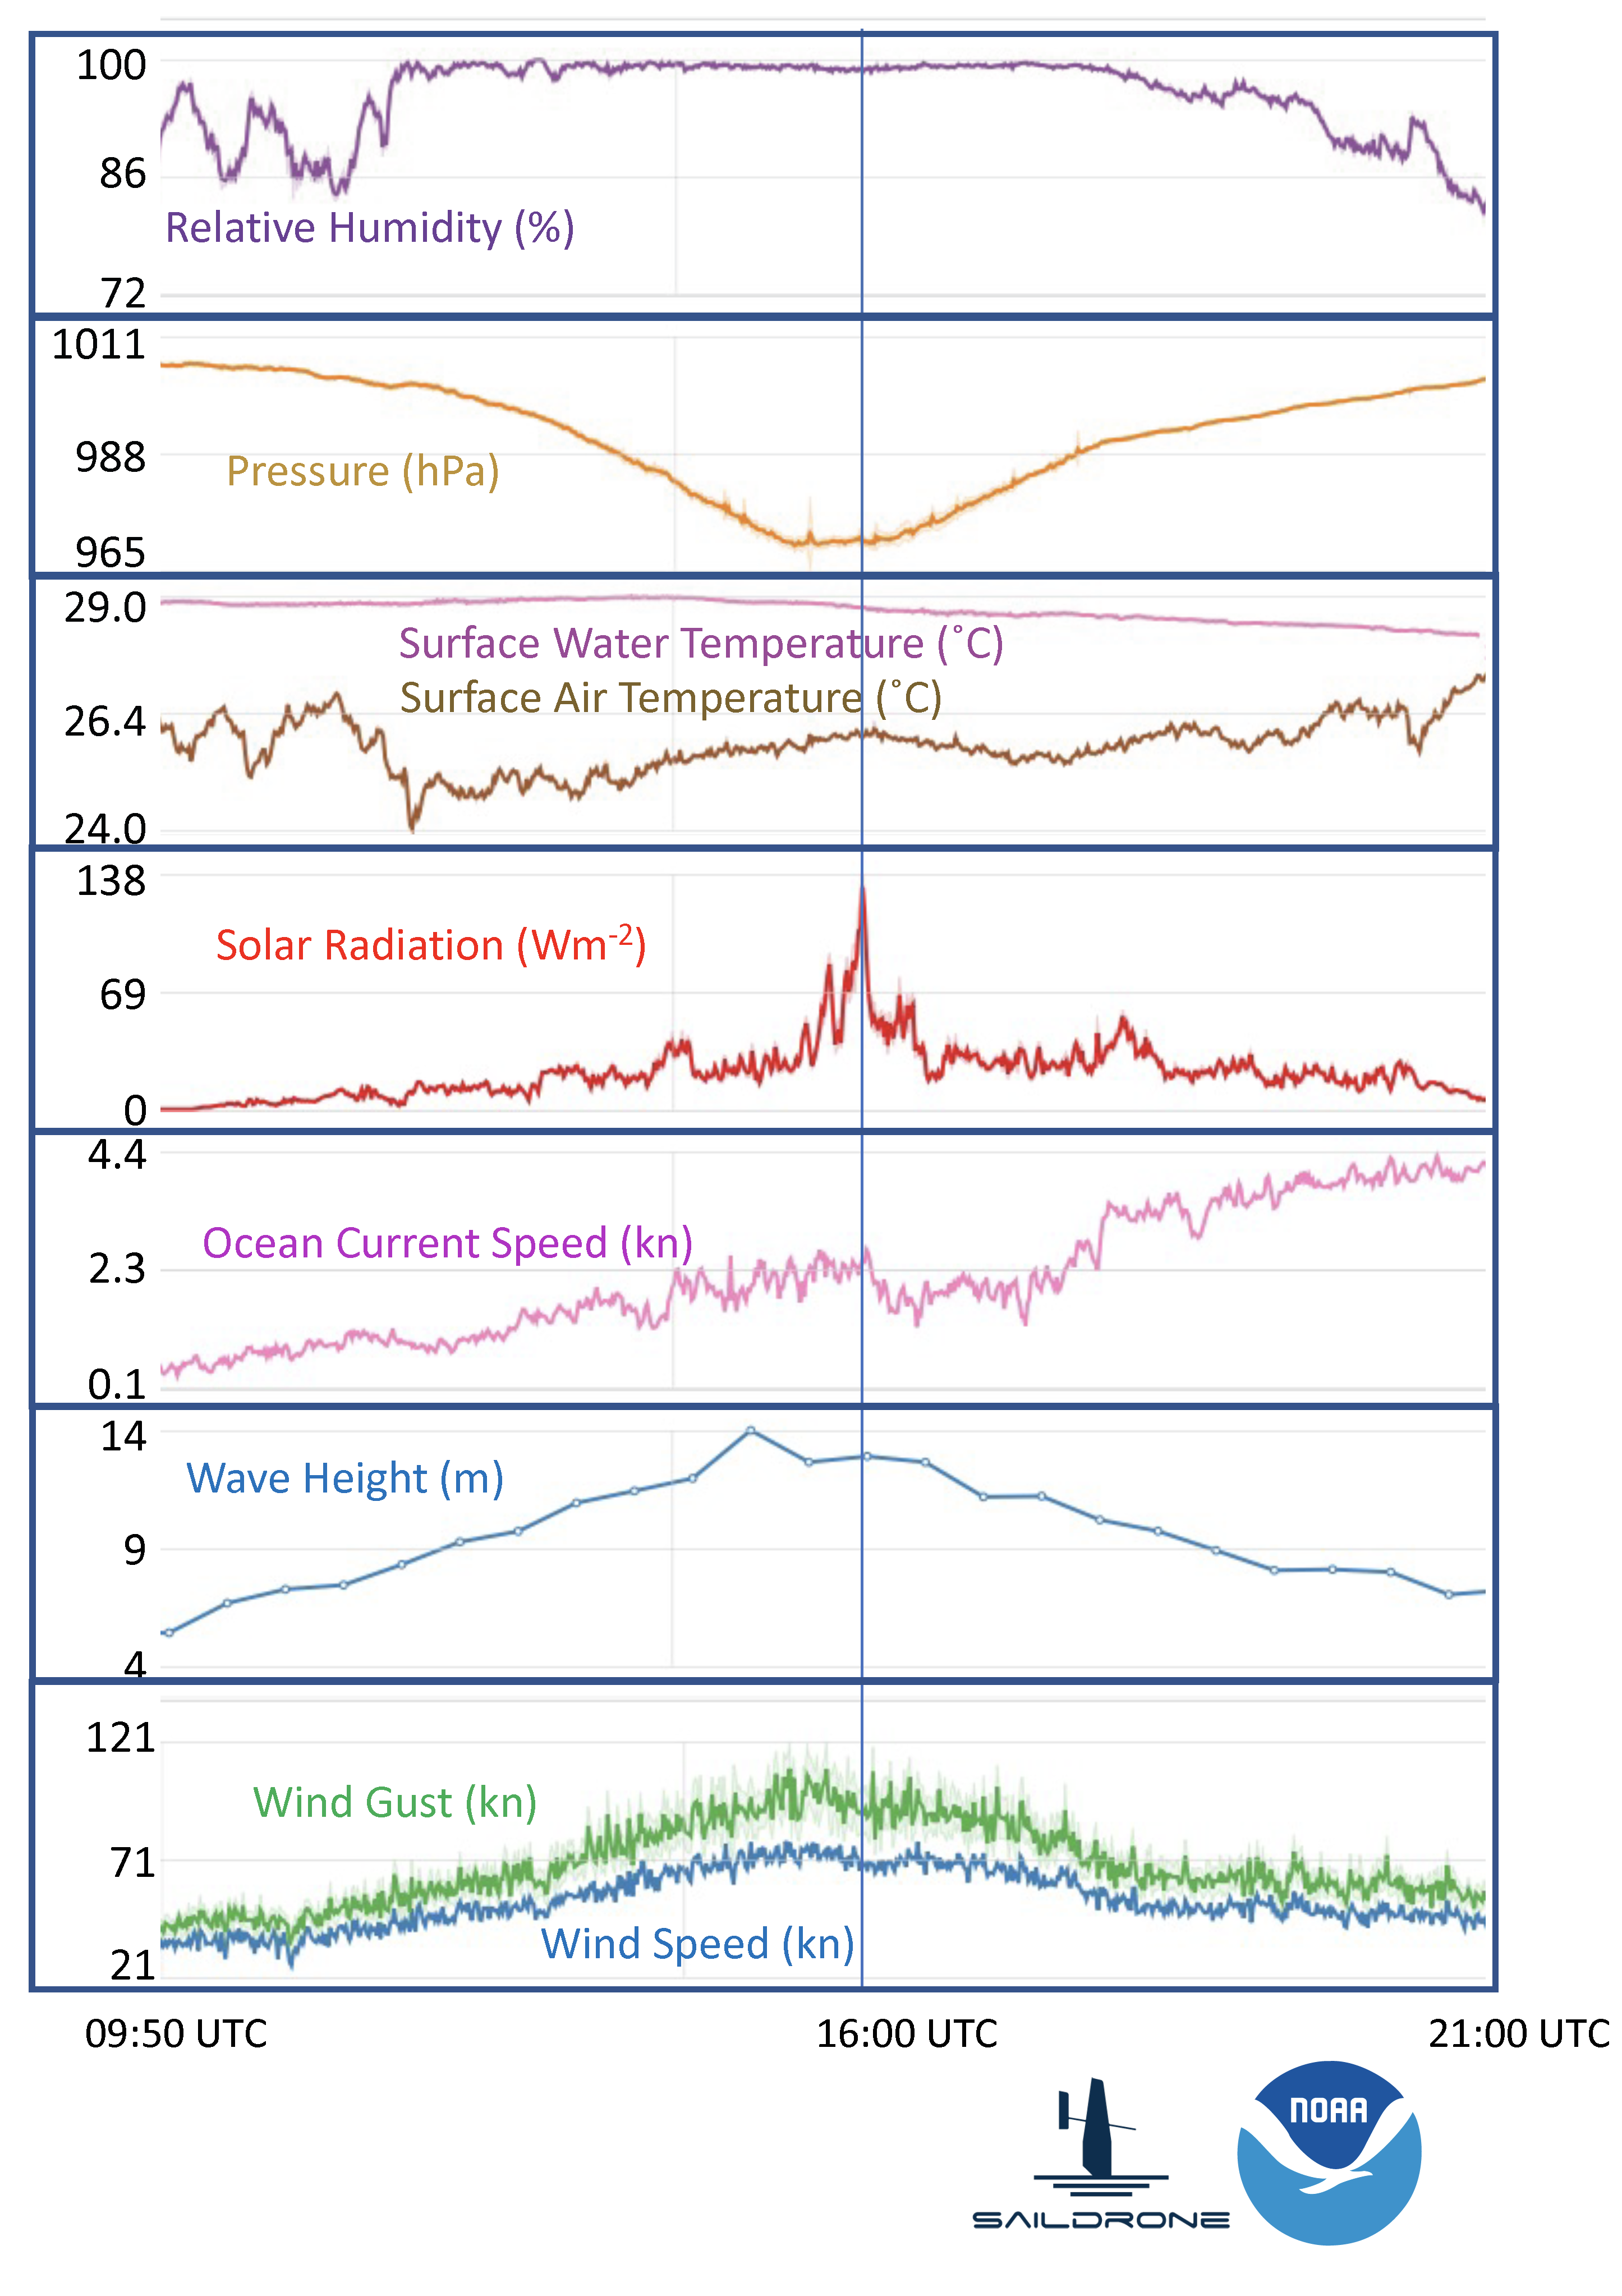
Time series of saildrone measurements of wind, humidity, pressure, current speed, wave heights and solar radiation on September 30, 2021. Vertical line marks the time when the saildrone was located inside the eyewall of Hurricane Sam. Click on image to view all the variables.
Saildrone 1045, one of the five drones PMEL and AOML deployed in the western Atlantic was steered into position to intercept Category 4 Hurricane Sam on September 30, 2021 to record critical data. The encounter required precise interpretation of hurricane forecasts and tight collaboration with Saildrone pilots. The saildrone measured one-minute sustained wind speeds of up to 90.6 miles per hour (40.5 m/s) with wind gusts up to 126.5 mph (56.5 meters/second), waves exceeding 46.4 feet (14.2 meters), and saturated air near the surface. The saildrone was in the hurricane eye next to the eyewall at 16:00 UTC / 12:00 EDT and was in sustained hurricane-force winds (at least 75 mph) for about two hours straight. The first ever drone camera images and video show a large amount of sea spray from the ocean surface and are a frightening display of the power of tropical cyclones.
This is the first time that sea surface conditions near a hurricane eye were observed by an uncrewed surface vehicle. Its success is built upon years of partnership between NOAA and Saildrone, Inc. with testing in progressively more hostile environments and 5 years of innovative engineering on the platform, sensors, and data processing, months of preparation leading to the deployment, and dedicated efforts of operating saildrones by the NOAA science team and Saildrone pilots during the deployment. An animation created by scientists at NOAA AOML shows how the saildrone was positioned to intercept Hurricane Sam alongside saildrone observations of Hurricane Sam.
Prior to hurricane Sam, the NOAA saildrones also measured tropical storms Peter (9/21/2021), Henri (8/20/2021), Grace (8/17/2021) and Fred (8/13/2021). Read more about these encounters on the mission blog: https://www.pmel.noaa.gov/saildrone-hurricane2021/mission_blog.html
Read more on NOAA.gov: A world first: Ocean drone captures video from inside a hurricane
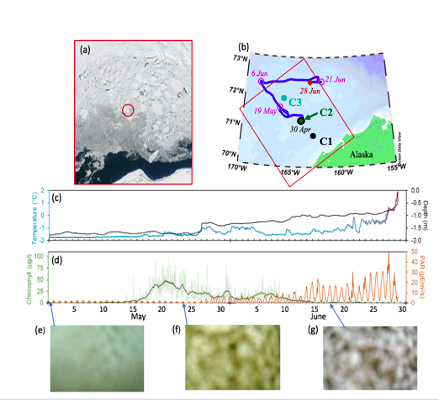
During the first Chukchi deployment, floats resurfaced under a sheet of floating ice (ice floe), monitored and tracked the ice region for almost two months and detected an under-ice algae bloom (Stabeno et. al, 2020). The bottom row shows the captured images with no bloom and/or algae.
After spending 8 months under water and ice, two of NOAA’s three Arctic-deployed pop-up floats have successfully surfaced in the Chukchi Sea and are transmitting data on temperature, pressure, photosynthetic active radiation (PAR), and chlorophyll fluorescence. These data are from measurements taken while the float is anchored to the seafloor, while it rises through the water column, and while it is trapped under the ice at the water-ice boundary.
The two floats were initially deployed in the fall of 2020 by the scientists and crew of NOAA Ship Oscar Dyson. These are part of the 4th cohort of deployments since 2017, and the second cohort deployed in the Chukchi Sea. The first float to surface has transmitted data from the four months it spent on the seafloor, just over a month of data from when it was trapped under ice, and about half of the photos it took while under ice. The second float has transmitted about five months of data from the seafloor, just over four months of data from under the ice along with the under-ice photos it captured, and 7 days of open ocean sea surface temperature.
Pop-up floats provide an inexpensive method to explore a unique micro-ecosystem under floating ice. The floats collect ocean health data to help researchers better understand the rapidly changing Arctic ecosystem. They collect data during the ice-covered winter and spring months, a time during which it isn’t possible for researchers to penetrate the ice from above to study the water underneath. The water column data they collect on their rise up from seafloor to surface is essential for researchers to monitor ongoing ecosystem changes in the Arctic, such as watching for harmful algal blooms and documenting biodiversity in the environment. The floats can also help researchers measure the extent of the cold pool, an area of cold water about 30 meters deep that results from melting Arctic ice from the previous season.
NOAA PMEL began development of these floats in 2015. The float is an orange sphere equipped with sensors to measure temperature, pressure, and other ocean conditions as well as cameras to capture under ice imagery. It is deployed during the ice-free summer months and anchors to the seafloor measuring bottom-ocean conditions. It stays here collecting measurements throughout the winter and early spring. It then rises up through the water column at a pre-programmed time, in this case early March to mid-April, capturing data at various depths to create a profile of the water column. The floats are then trapped under ice when it reaches the surface, and will continue collecting data and images of conditions at the water-ice boundary. When the ice melts in mid-May and early June, the floats can emerge fully from the ice to reach the surface and begin transmitting their stored data, while continuing to monitor sea surface temperature.
Read more about the 2020 pop-up deployments in Arctic Today and on the ITAE website.
As the western U.S. experiences record shattering heat waves, mega droughts and the eastern tropical Pacific started its 2021 hurricane season with the earliest tropical storm (Andres) on record going back to the early 1970s, two Uncrewed Surface Vehicle (USV) saildrones were launched on July 23, 2021 from Alameda, CA on a research mission to the eastern tropical Pacific.
The eastern tropical Pacific is a key region for hurricane genesis and El Niño Southern Oscillation (ENSO) development. The ENSO cycle not only modulates hurricane genesis in the eastern tropical Pacific and the tropical Atlantic, but also affects the global marine ecosystem and weather patterns on land. The hurricanes and tropical cyclones generated in the eastern tropical Pacific, whether or not they make landfall, control the critical source of moisture for rainfall, especially over western North America.
This region, however, is a gap in the Tropical Pacific Observing System (TPOS). The two saildrones enroute to the eastern tropical Pacific, will test how USVs may be used to address gaps in the present TPOS. The 150-day mission will target several phenomena including:
- Air-sea interactions and convective development in the eastern Pacific hurricane genesis region
- Air-sea interactions, including carbon dioxide outgassing, in the equatorial upwelling zone
- Wind convergence in the southeastern Inter-Tropical Convergence Zone (ITCZ) between 2°S and 5°S, often referred to as “the double ITCZ” region due to common biases of this phenomenon in models
- Air-sea interactions in the frontal zone north of the cold equatorial upwelling; and
- Contrasting subtropical and tropical oceanic and atmospheric states in the eastern Pacific.
The mission is funded in part by NOAA Office of Marine and Aviation Operations (OMAO), NOAA Global Ocean Monitoring and Observing Program (GOMO), and NOAA National Oceanographic Partnership Program (NOPP) bringing together partners across NOAA, universities, and industry, along with international partners from Mexico and France. Read more about the mission on PMEL's Ocean Climate Station page.
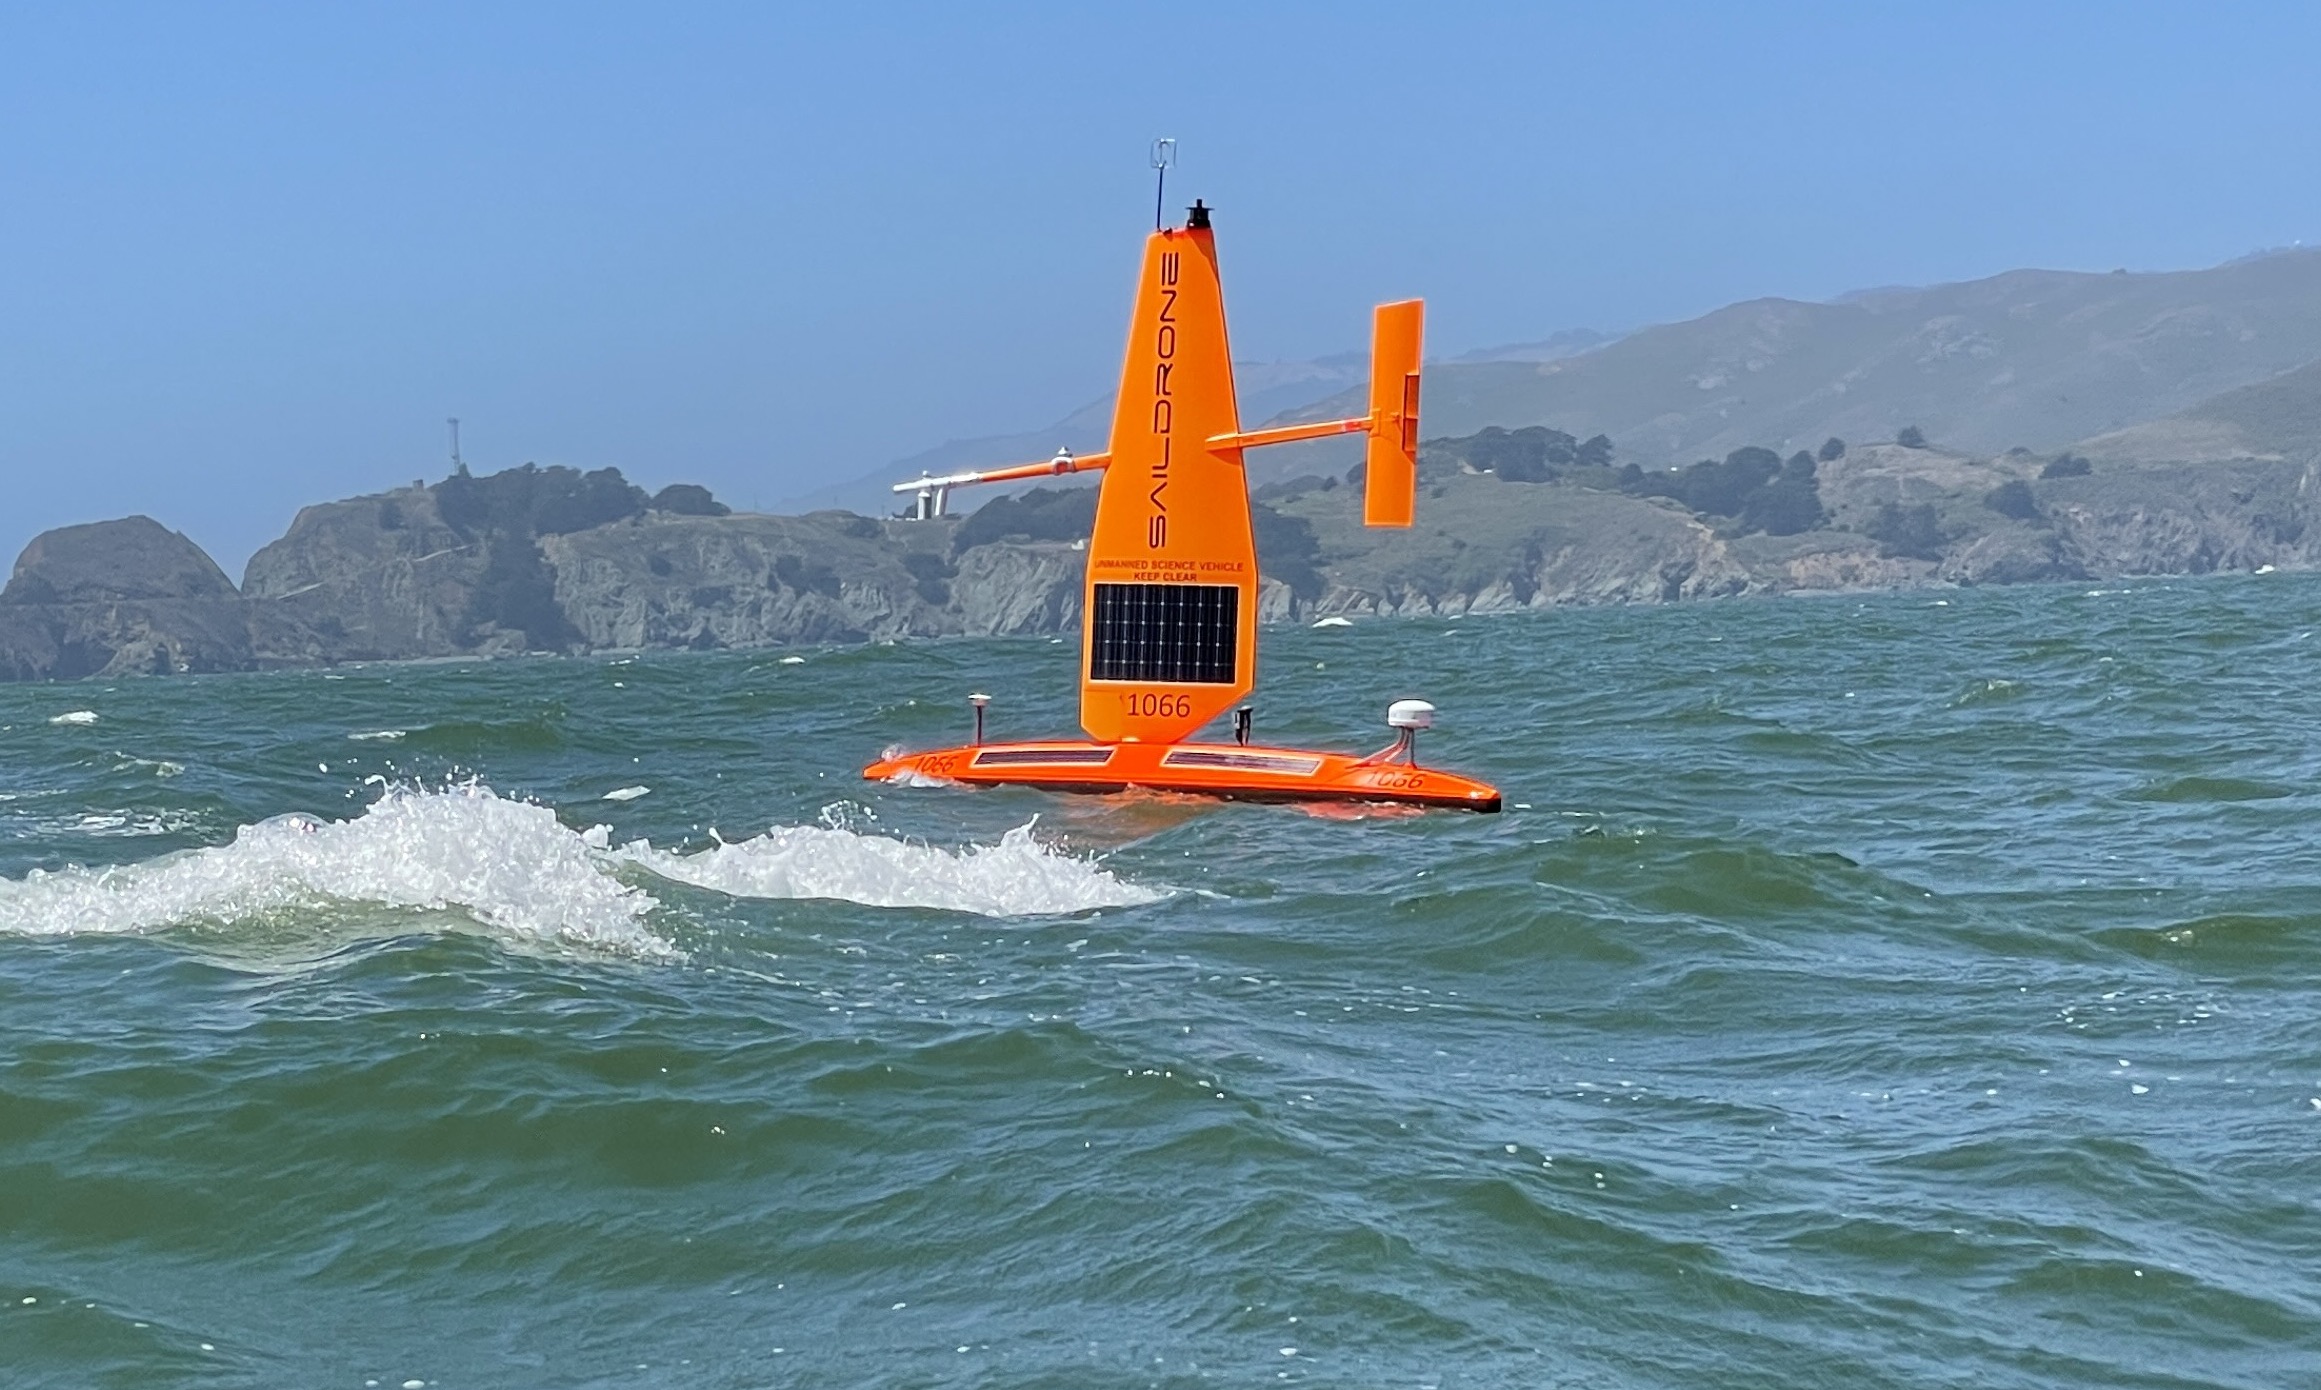
Saildrone departing Alameda, CA to study hurricane genesis and ENSO in eastern Pacific Ocean. Photo Credit: Saildrone, Inc.
As the western U.S. experiences record shattering heat waves, mega droughts and the eastern tropical Pacific started its 2021 hurricane season with the earliest tropical storm (Andres) on record going back to the early 1970s, two Uncrewed Surface Vehicle (USV) saildrones were launched on July 23, 2021 from Alameda, CA on a research mission to the eastern tropical Pacific.
The eastern tropical Pacific is a key region for hurricane genesis and El Niño Southern Oscillation (ENSO) development. The ENSO cycle not only modulates hurricane genesis in the eastern tropical Pacific and the tropical Atlantic, but also affects the global marine ecosystem and weather patterns on land. The hurricanes and tropical cyclones generated in the eastern tropical Pacific, whether or not they make landfall, control the critical source of moisture for rainfall, especially over western North America.
This region, however, is a gap in the Tropical Pacific Observing System (TPOS). The two saildrones enroute to the eastern tropical Pacific, will test how USVs may be used to address gaps in the present TPOS. The 150-day mission will target several phenomena including:
- Air-sea interactions and convective development in the eastern Pacific hurricane genesis region
- Air-sea interactions, including carbon dioxide outgassing, in the equatorial upwelling zone
- Wind convergence in the southeastern Inter-Tropical Convergence Zone (ITCZ) between 2°S and 5°S, often referred to as “the double ITCZ” region due to common biases of this phenomenon in models
- Air-sea interactions in the frontal zone north of the cold equatorial upwelling; and
- Contrasting subtropical and tropical oceanic and atmospheric states in the eastern Pacific.
The mission is funded in part by NOAA Office of Marine and Aviation Operations (OMAO), NOAA Global Ocean Monitoring and Observing Program (GOMO), and NOAA National Oceanographic Partnership Program (NOPP) bringing together partners across NOAA, universities, and industry, along with international partners from Mexico and France. Read more about the mission on PMEL's Ocean Climate Stations page.
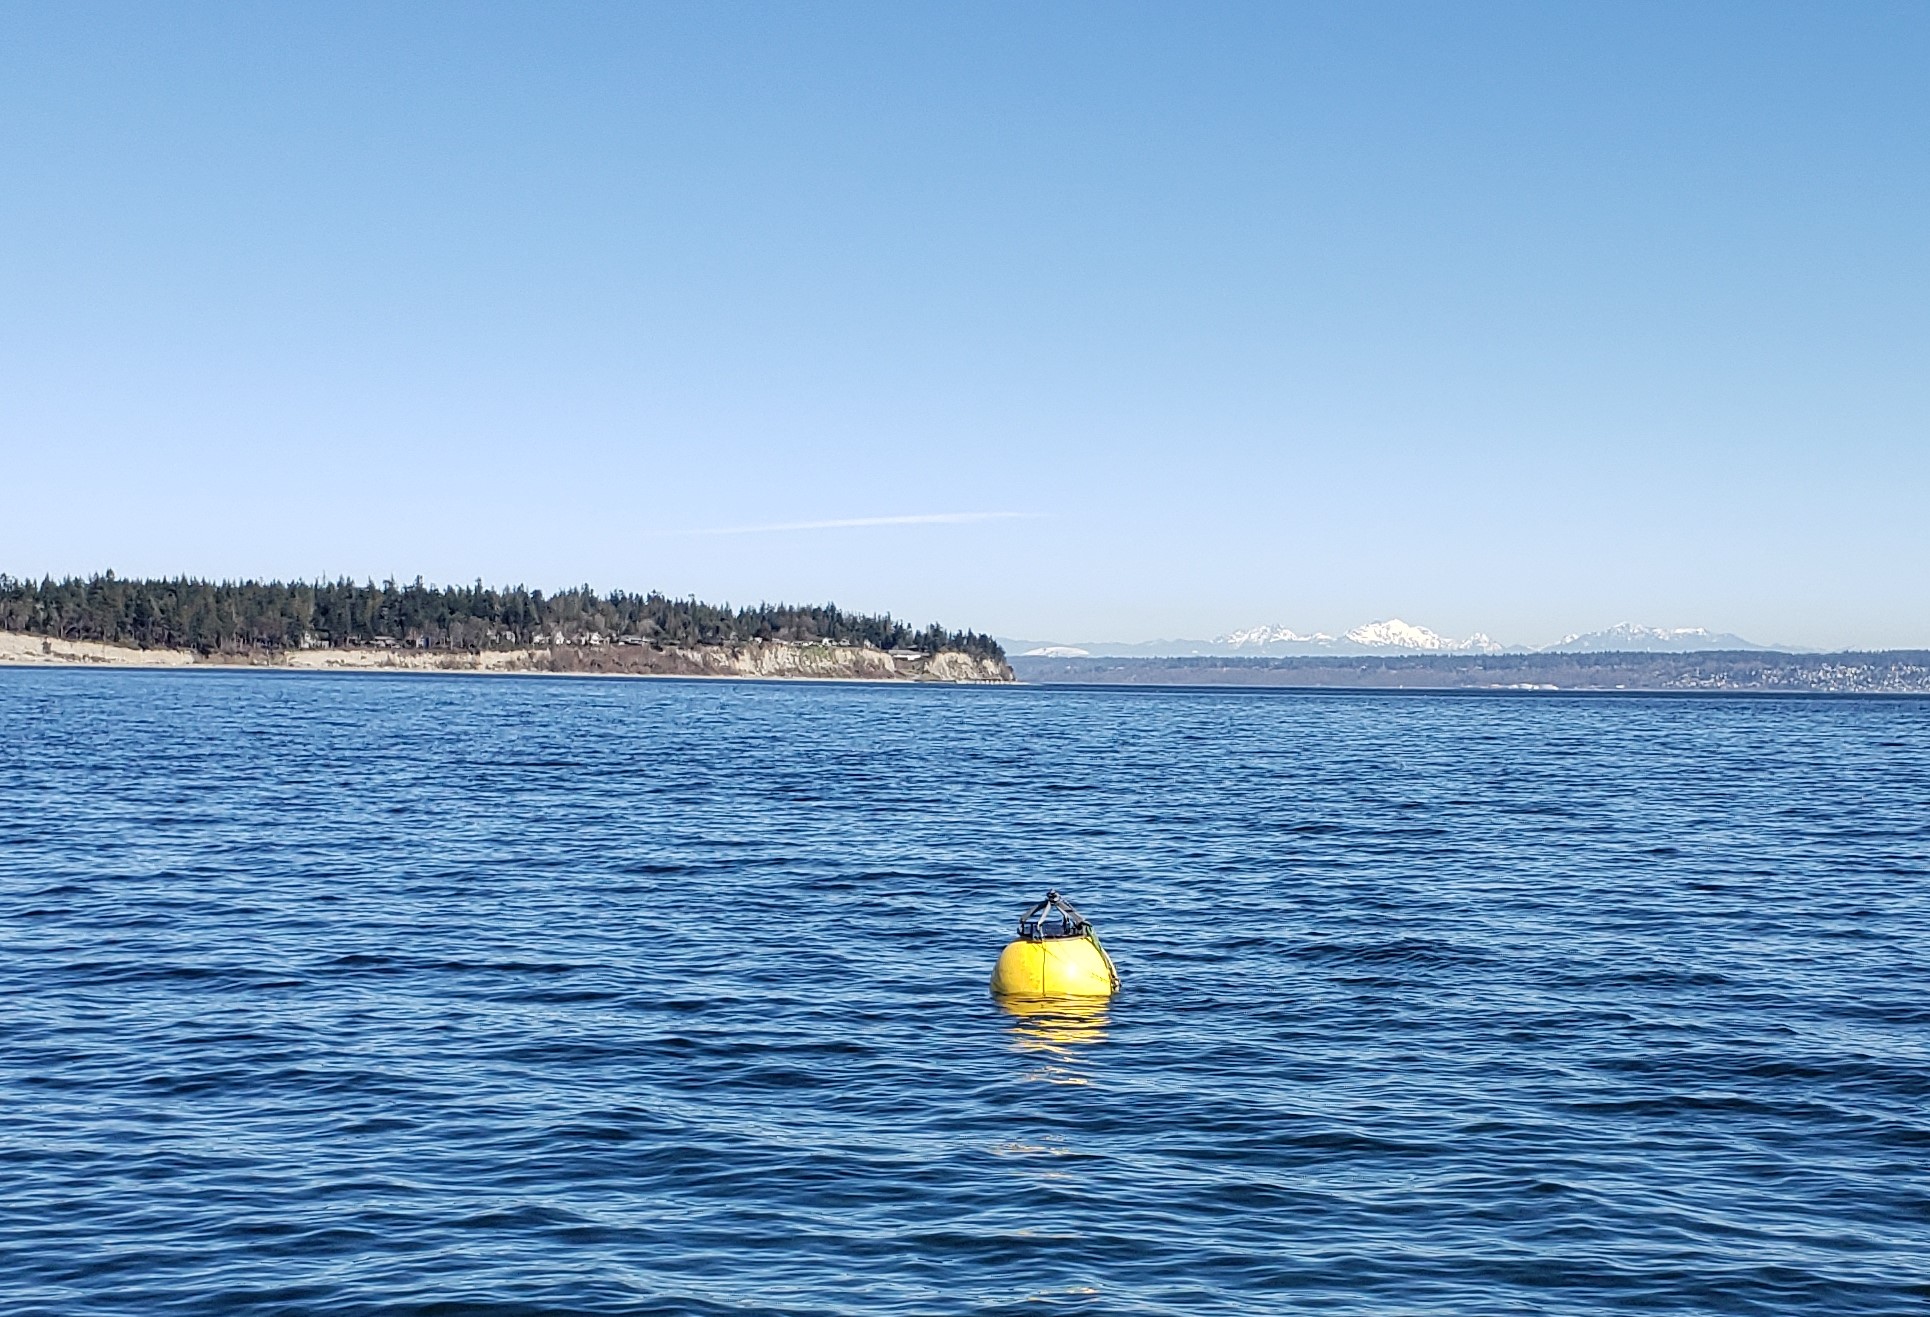
Flotation Controllable Ocean Mooring (FCOM) system resurfacing during testing in Puget Sound.
After 8 months of sitting on the seafloor, PMEL’s latest engineering development, the Flotation Controllable Ocean Mooring (FCOM) system successfully resurfaced in July. Over the last two years, PMEL has been developing a profiling mooring for use in Arctic regions that submerges when ice arrives in the fall and refloats in the spring after ice retreat. The FCOM system has a surface float that is anchored to the ocean floor, and includes a Prawler that moves up and down the mooring line collecting profiles of temperature, salinity, chlorophyll, and dissolved oxygen. This innovation will provide real-time information of the full water column during the entire open water (sea ice free) season.
The Chukchi Sea is an ice-driven system. Collecting data during the spring and fall is crucial for monitoring ecosystem production and generating ice forecasts. Data collection during spring and fall is difficult as there are few vessels in the region during those times, and moorings must be placed near the seafloor to avoid ice keels which prevents real time data return on the status of the full water column. Prior to FCOMs, surface floats could only sample for a short period because deployment and recovery were dependent upon the tight scheduling of research vessels. This mooring addresses these long-standing science gaps.
The mooring was originally deployed from the R/V Ocean Starr in spring of 2019 in the Chukchi Sea with pre-programmed dates to sink and resurface. It sank in October 2019, resurfaced in July 2020 and will be recovered in September. The next version of FCOM will be outfitted with a hydrophone and ice-detection algorithms so that it can resurface after ice retreats without having a pre-programmed date. Ultimately, the FCOM with a Prawler is intended to be integrated into NOAA’s Arctic observing system.
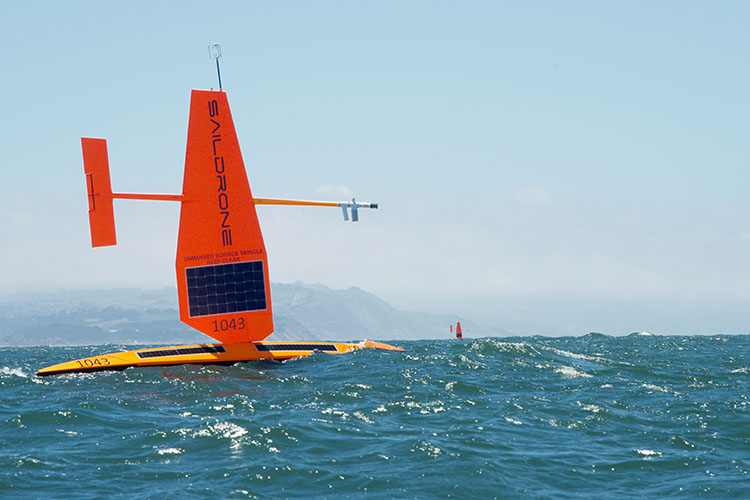
Two saildrones in the Pacific Ocean just west of the Golden Gate Bridge at the start of their journey. Photo Credit: Saildrone, Inc.
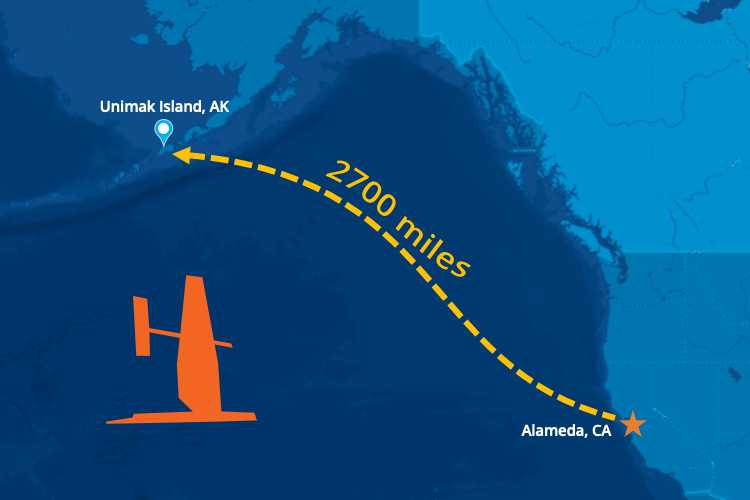
Three saildrones left Alameda, California in May and have arrived at Unimak Pass in Alaska’s remote Aleutian Islands to collect valuable abundance data to support sustainable management of the largest commercial fishery in the United States.
Three saildrones left Alameda, California in May and have arrived at Unimak Pass in Alaska’s remote Aleutian Islands. The ocean drones have sailed nearly 2,700 miles at a walking pace, about 2.5 miles per hour (2 knots), which is just about the distance from Seattle to Miami. Once they navigate through the pass, the saildrones will enter the Bering Sea. This is where they will conduct a two month-long acoustic survey of walleye pollock to collect some critically needed data to support management of the nation’s largest commercial fishery for Alaska pollock. They are expected to reach their first survey station in about a week and will cover roughly the same area normally covered by standard research vessels.
The data the drones collect will help to fill in the gap for fisheries stock assessment scientists who monitor the changes in pollock populations to advise fisheries management. The sonar measurements made by the ocean drones will provide valuable insights on pollock abundance and distribution in 2020.
The mission is led by NOAA's Alaska Fisheries Science Center with scientists at the Pacific Marine Environmental Laboratory processing the oceanographic and meteorological data in real time. Data will be made available to weather forecasts center worldwide via the World Meteorological Organization's Global Telecommunication System (GTS) so that these observations can be incorporated into weather predictions. PMEL, AFSC and Saildrone have collaborated on several missions in the Arctic since 2015 to develop the vehicle’s capabilities and refine the sensors.
PMEL, AFSC and Saildrone have collaborated on several missions in the Arctic since 2015 to develop the vehicle’s capabilities and refine the sensors.
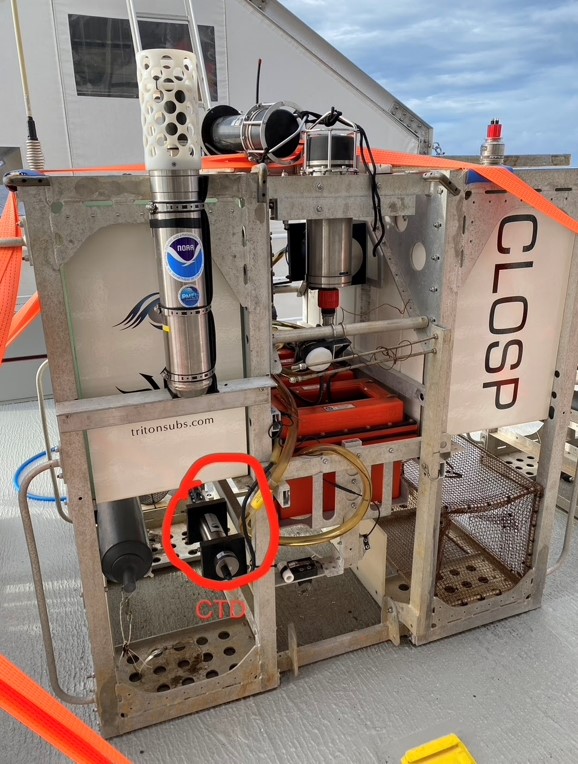
The full-ocean depth hydrophone (top left) attached to the CLOSP lander along with a conductivity, temperature and depth sensor (CTD). The lander also stores geological and biological samples collected by the submersible. Photo Credit: Kathy Sullivan/Caladan Oceanic
PMEL Acoustics Program and Engineering Development Division participated as part of a memorandum of understanding between NOAA and Caladan providing subject matter expertise on pressure sensors and acoustics during the June mission in the Mariana Trench to map the Challenger Deep with pressure sensors and collect oceanographic data. A full-ocean depth hydrophone was deployed during the Ring of Fire Expedition at Challenger Deep. The hydrophone was deployed on a lander with several deep-ocean pressure sensors over two cruises in the Challenger Deep basin. In addition, water samples for environmental DNA analysis have also been collected.
The first dive was completed on June 8 by Kathy Sullivan and Victor Vescovo aboard the Limiting Factor, a two-person submersible built by Triton Submarines and Caladan Oceanic. The recordings from the hydrophone are also part of acoustics research conducted by Woods Hole Oceanographic Institution to determine how sound waves propagate in the deepest parts of the ocean.
PMEL successfully first deployed the hydrophone in 2015 to establish a baseline for noise in the ocean’s deepest location. The recordings captured a baleen whale’s call, a magnitude 5.0 earthquake, an overhead typhoon and ship traffic noise.