
|
|
||
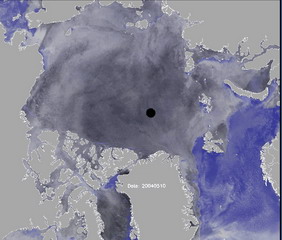
Sea Ice Animation |
|||
|
by Mr. Tom Agnew
This animation uses the Advanced Microwave Scanning Radiometer (AMSR_E) data obtained from the National Snow and Ice Data Center (NSIDC). The images are in the standard sea ice polar stereographic 6.25 km grid and are colorized using both H and V polarization 89 Ghz channels. Sea ice shows up as various shades of grey and open ocean as blue. Each image is a snapshot of sea ice cover each day with the date shown in the lower part of each image. By operating in the microwave region of the EM spectrum the sensor is able to see the sea ice surface without solar illumination and through most cloud and precipitation. Only in the presence of very thick cloud/heavy precipitation is the sea ice surface lost. As summer approaches this happens more frequently until the sea ice surface is almost completely lost in July and August. When these images are animated, the faster cloud motions should be ignored. In general lighter shades of grey are newly formed first year ice and the dark shades of grey are older multi-year ice. The motion of large ice floes and the formation leads can be seen quite well during the winter months.
|
|||
| About | http://www.pmel.noaa.gov/arctic-zone/detect oar.pmel.arctic.webmaster@noaa.gov DOC | NOAA | PMEL | Arctic Zone | Arctic Change Detection Privacy Policy | Disclaimer |